
The Stock Market, Credit and Capital Formation
Tables
TABLE I.
_____
BROKERS’ BORROWINGS
NET BORROWINGS ON COLLATERAL (ON CALL AND ON TIME) IN NEW YORK CITY
AS REPORTED BY MEMBERS OF THE NEW YORK STOCK EXCHANGE
In Millions of Dollars
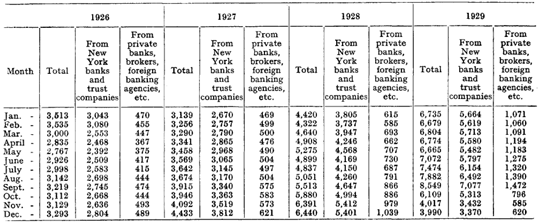
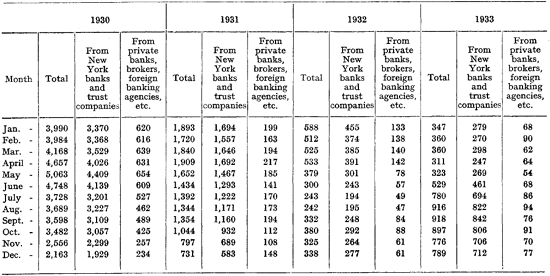
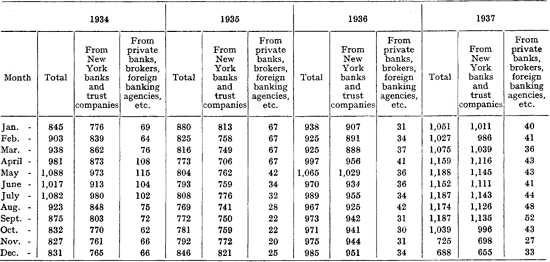
Sources: 1926-1929—Annual Reports of the Federal Reserve Board (end of month figures).
1930-1937—New York Stock Exchange Bulletins (first of month figures).
TABLE II.
_____
MONEY LOANED OUT BY BROKERS
1932–1935
TOTAL OF MONEY LOANED IN FIRM NAME EXCLUSIVE OF
MONEY LOANED AS AGENT FOR OTHERS
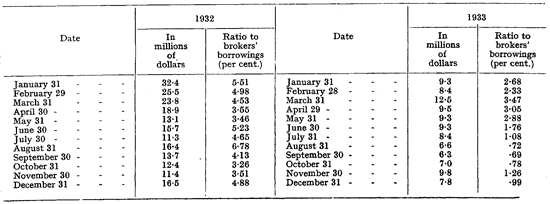
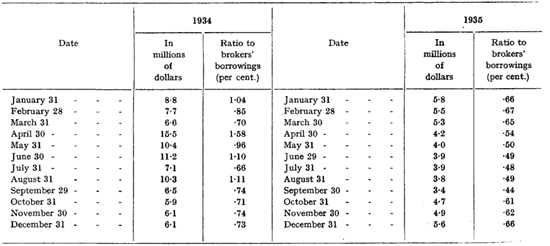
Source: New York Stock Exchange (unpublished).
TABLE III
_____
BROKERS’ LOANS
1922–1925
STREET LOANS (ON CALL AND ON TIME) BY REPORTING MEMBER BANKS
IN NEW YORK CITY
Monthly Averages of Weekly Figures—in Millions of Dollars
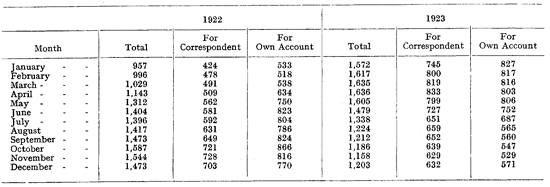
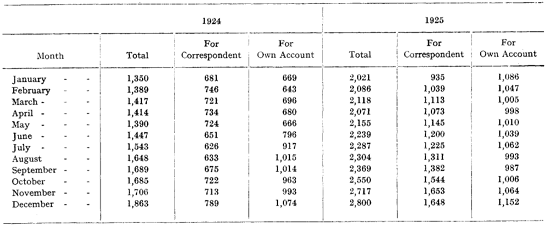
Source: Annual Report of the Federal Reserve Board, 1927.
TABLE IV
_____
BROKERS’ LOANS
1926–1935
LOANS TO BROKERS AND DEALERS (ON CALL AND ON TIME) SECURED BY STOCKS AND BONDS, MADE BY REPORTING MEMBER BANKS IN NEW YORK CITY
In Millions of Dollars
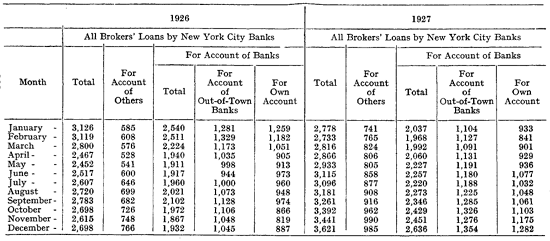
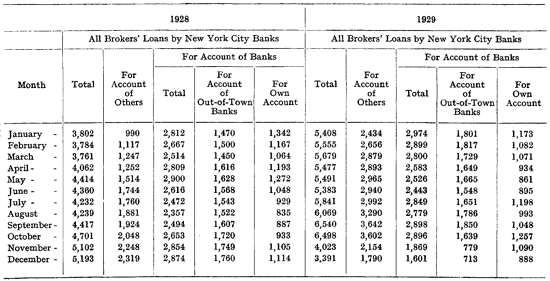
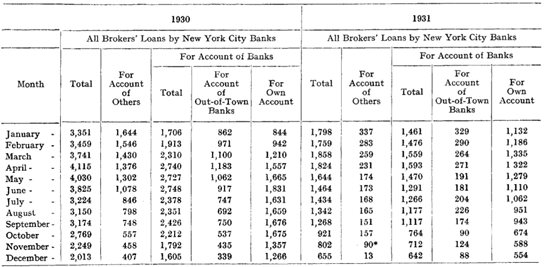
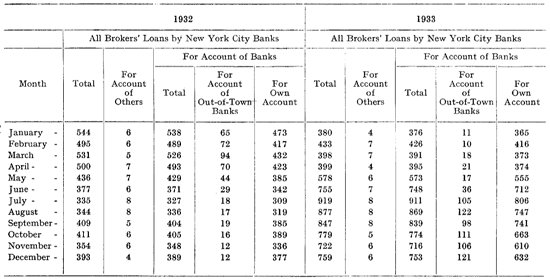
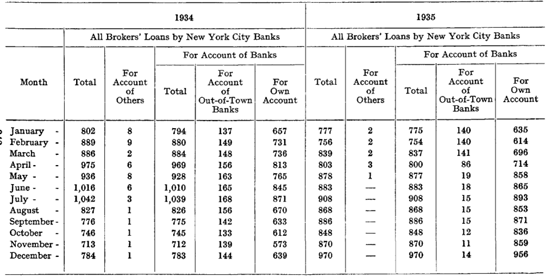
* November 16, 1931—New clearing-house rule.
Source: Annual Reports of the Federal Reserve Board and Federal Reserve Bulletins.
TABLE IVa
BROKERS’ LOANS
_____
1936–1939
_____
LOANS TO BROKERS AND DEALERS (ON CALL AND ON TIME) SECURED BY STOCKS AND BONDS, MADE BY REPORTING MEMBER BANKS IN NEW YORK CITY—FOR OWN ACCOUNT
(in Millions of Dollars)
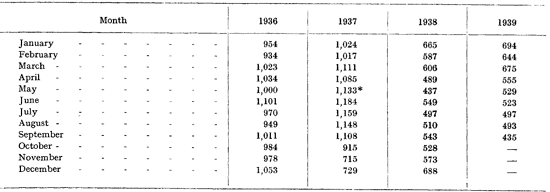
* Loan classification revised May 19, but figures are still sufficiently comparable.
Source: Annual Reports of the Federal Reserve Board and Federal Reserve Bulletins.
TABLE V.
_____
COMPARISON OF BROKERS’ LOANS WITH ALL LOANS BY MEMBER BANKS, AND ALL
LOANS AND INVESTMENTS BY MEMBER BANKS ON CALL DATES
1928–1939
(In Millions of Dollars)
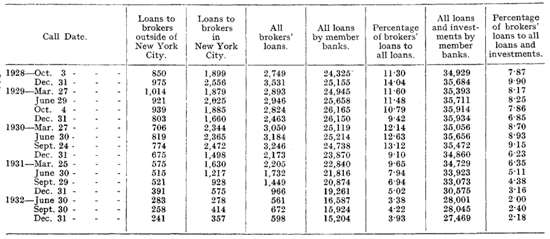
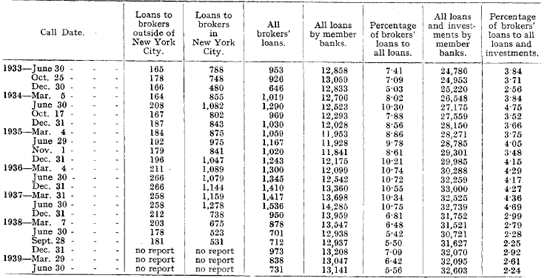
Sources: Annual Reports of the Federal Reserve Board and Federal Reserve Bulletins.
TABLE VI
_____
AVERAGE RATE ON STOCK EXCHANGE NEW CALL LOANS
1922–1939
Per Cent. per Annum
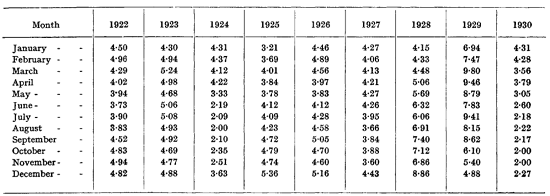
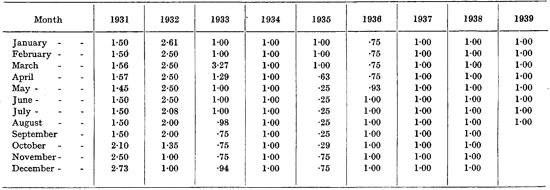
Source: Annual Reports of the Federal Reserve Board and Federal Reserve Bulletins.
NOTE.—The statistics for 1937 to 1939 are for call loan renewals, not new call loans. However, the difference between the tow rates is usually negligible.
TABLE VII
_____
CAPITAL ISSUES
1922–1938
In Millions of Dollars
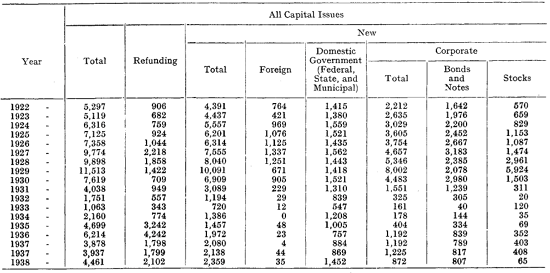
Sources: Annual Reports of the Federal Reserve Board and Federal Reserve Bulletins.
TABLE VIII
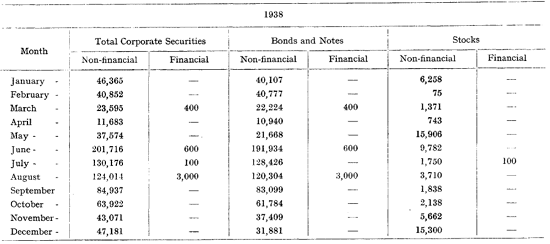
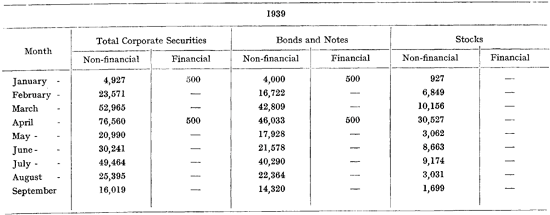
UNITED STATES DOMESTIC NEW CORPORATE SECURITES
(NON-FINANCIAL AND FINANCIAL)
_____
1922–1939
In Thousands of Dollars
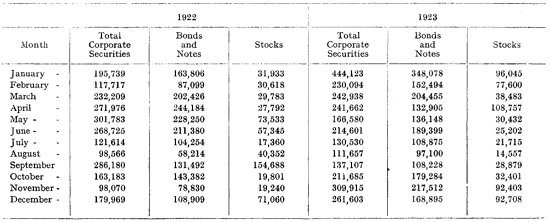
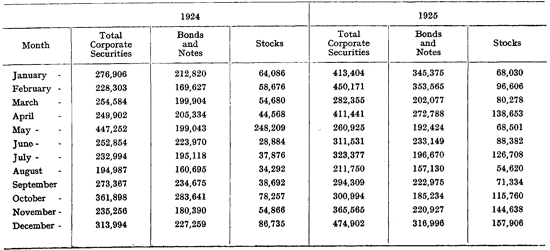
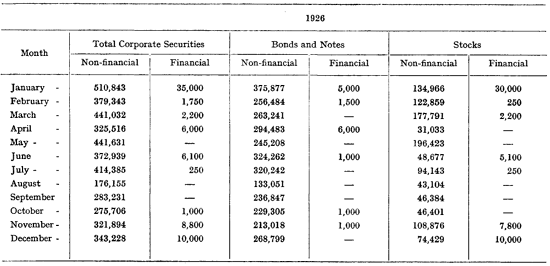
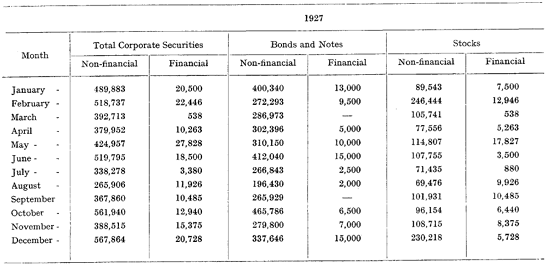
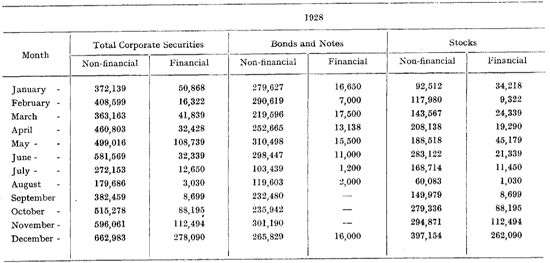
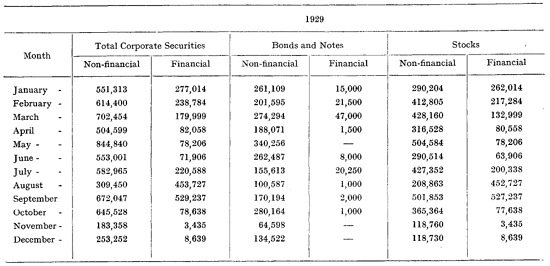
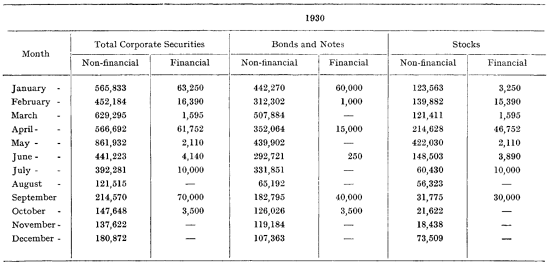
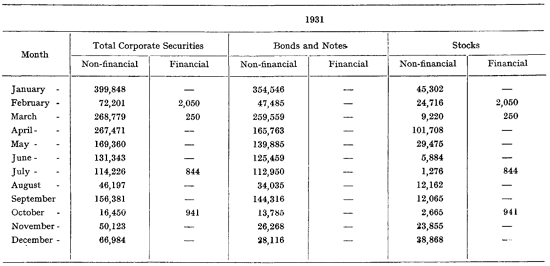
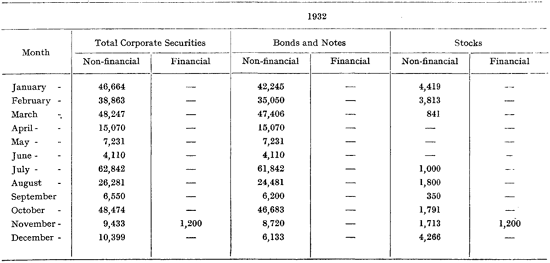
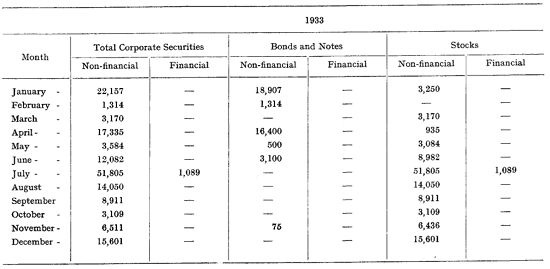
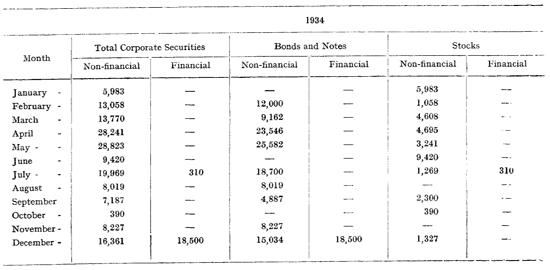
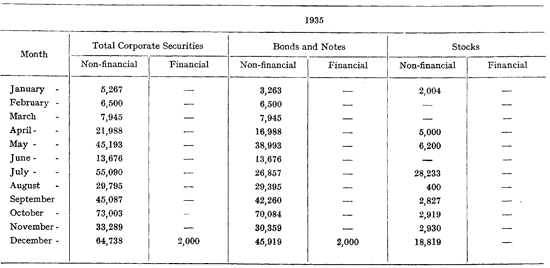
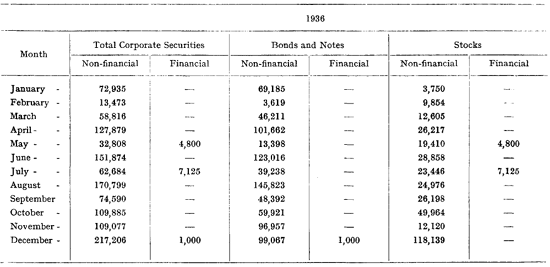
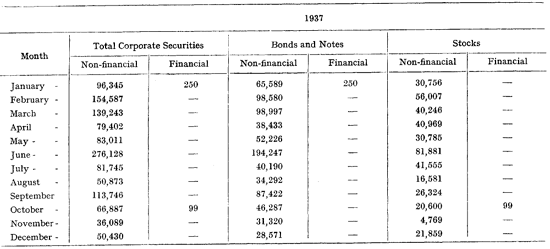
Source: Commercial and Financial Chronicle.
NOTES.—The columns “Non-financial” were obtained by subtracting the issues of investment trusts, holding companies, etc., from their totals.
The column “Bonds and Notes” includes both long and short-term issues.
For the year 1922-1925 no separate figures were published for financial issues.
TABLE IX
_____
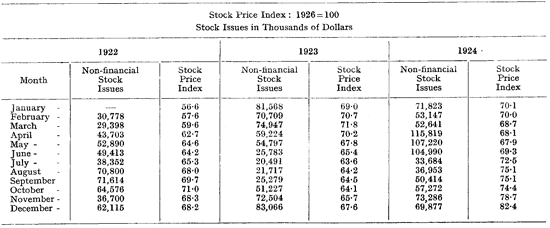
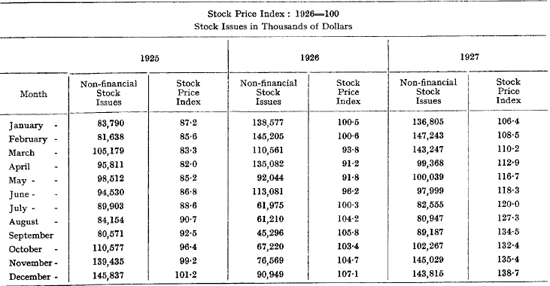
THREE MONTHS MOVING AVERAGE OF NON-FINANCIAL STOCK
ISSUES AND THE STANDARD STATISTICS STOCK PRICE INDEX
1922–1939
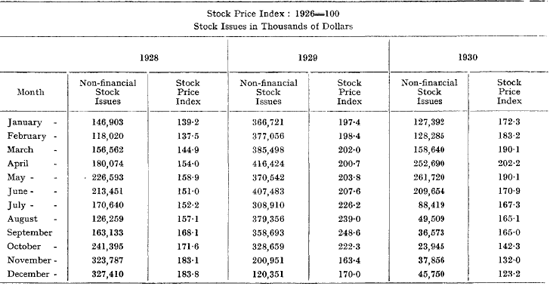
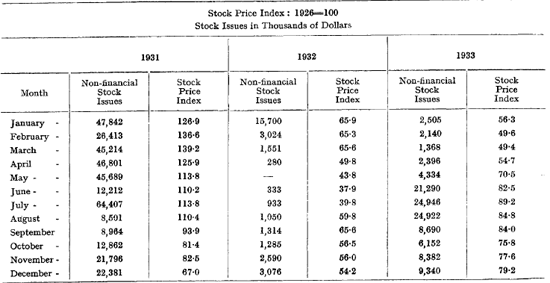
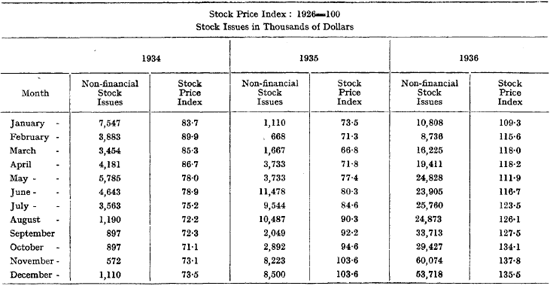
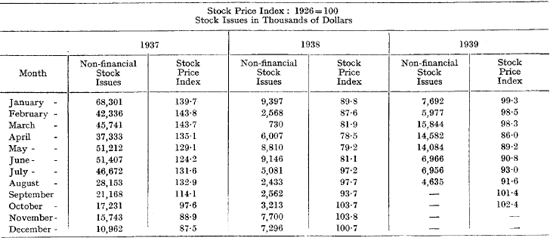
Sources: For stock issues, see preceding table.
For stock price index: Standard Statistics Company, STANDARD TRADE AND SECURITIES.
NOTE ON THE STANDARD STOCK INDEX:—“In relatives, 1926 = 100. Weighted by the number of shares of each stock outstanding. Corrected for the value of rights, stock dividends, changes in par value, and consolidations. Since 1926 the indexes are an average of Standard’s Daily Stock Price Index. Prior to 1926 averages of the monthly high-low prices were used.”
TABLE X
_____
CAPITAL MOVEMENTS
1922–1938
UNITED STATES BALANCE OF INTERNATIONAL PAYMENTS
In Millions of Dollars
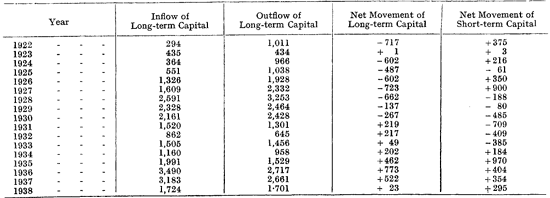
Sources: United States Department of Commerce. The Balance of International Payments of the United States. Federal Reserve Bulletins.
TABLE XI
_____
CASH BALANCES OF BROKERS COMPARED WITH
MARGIN LOANS TO CUSTOMERS, BROKERS’ BORROWINGS, AND
CUSTOMERS’ BROKERAGE DEPOSITS
1935–1939
Member Firms of New York Stock Exchange—Ledger Balances in Millions of Dollars
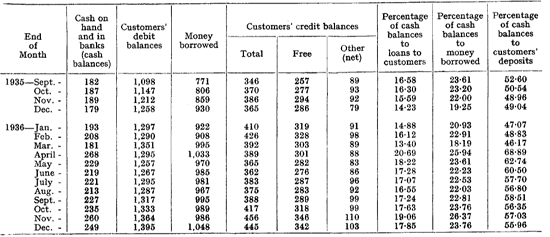
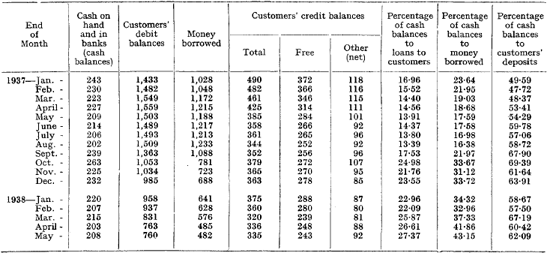
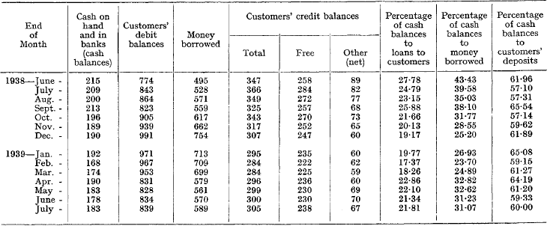
Sources: Annual Reports of the Federal Reserve Board and Federal Reserve Bulletins.
TABLE XII
_____
COMPARISON OF BROKERS’ CASH BALANCES
WITH STOCK PRICES AND BROKERS’ BORROWINGS
1935–1939
January, 1936 = 100
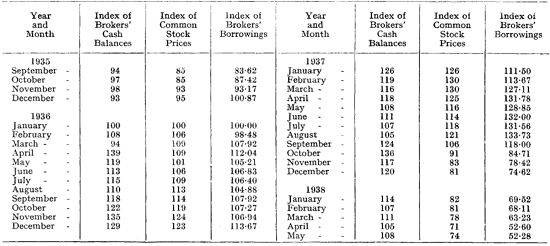
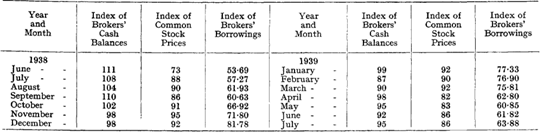
Sources:—Annual Reports of the Federal Reserve Board and Federal Reserve Bulletins.
TABLE XIII
_____
OBVIATION OF CHECK PAYMENTS
THROUGH STOCK EXCHANGE CLEARING
1925–1938

Source: New York Stock Exchange Bulletins.
TABLE XIV
_____
TOTAL CLEARING HOUSE TRANSACTIONS AND
CLEARING HOUSE BALANCES SETTLED BY CHECK
1929–1938
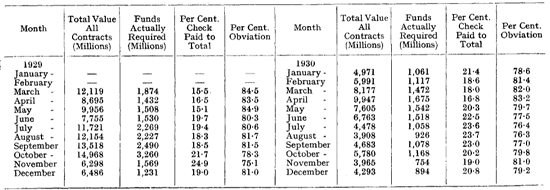
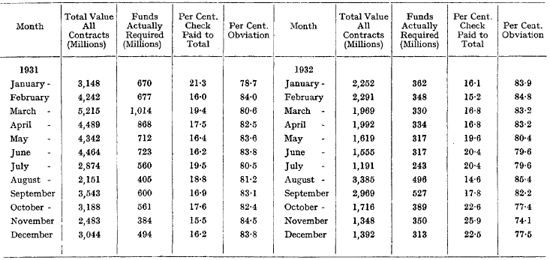
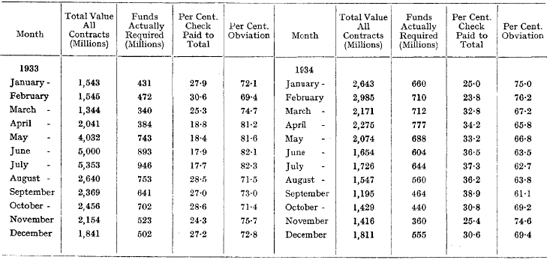
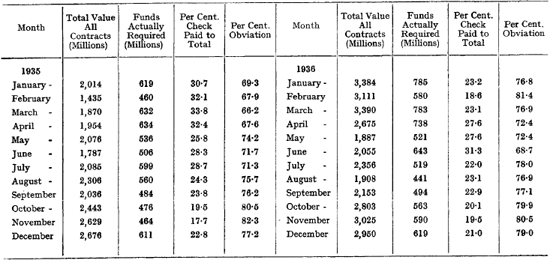
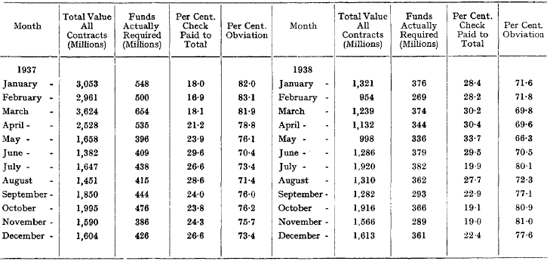
Source: New York Stock Exchange Bulletins.
TABLE XV
_____
BROKERS’ CASH BALANCES, TOTAL CLEARING HOUSE TRANSACTIONS,
AND CLEARING HOUSE BALANCES SETTLED BY CHECK
1935–1939
In Millions of Dollars January, 1936 = 100
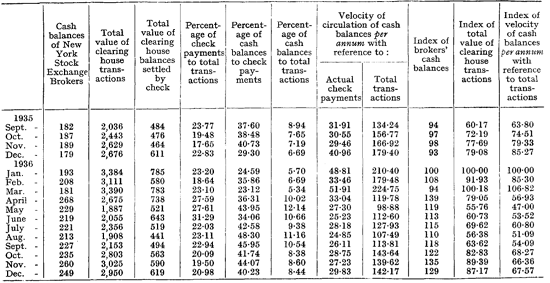
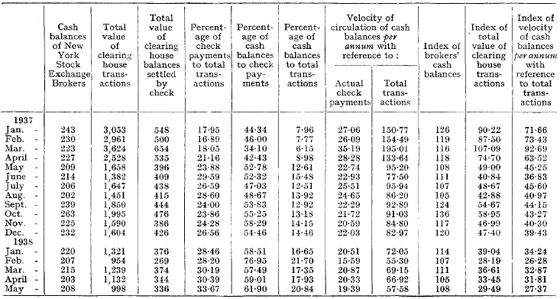
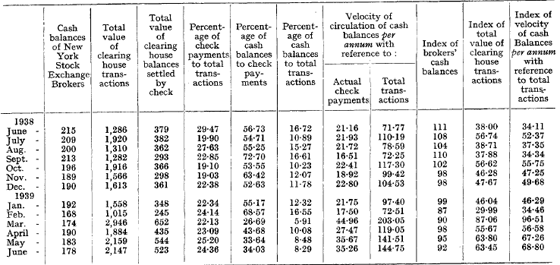
Sources: For cash balances—Annual Reports of the Federal Reserve Board and Federal Reserve Bulletins.
For clearing house transactions—New York Stock Exchange Bulletins.
TABLE XVI
_____
TRANSACTIONS AND CUSTOMERS’ BALANCES
1932–1939
In Millions of Dollars January, 1932 = 100
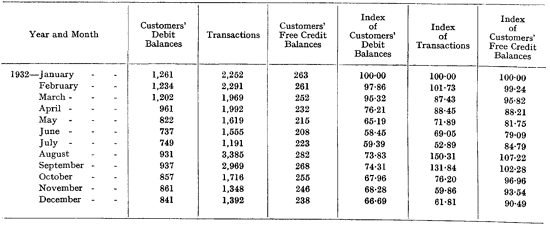
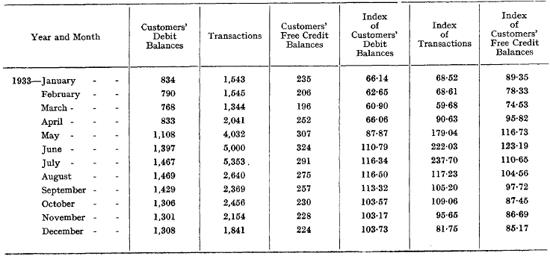
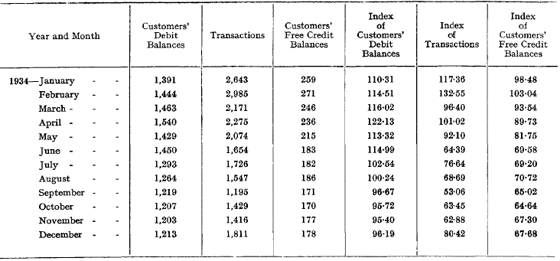
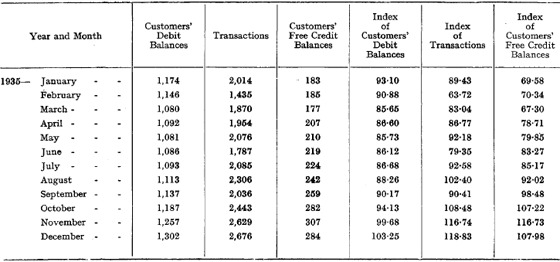
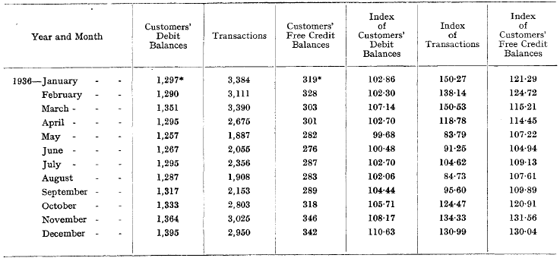
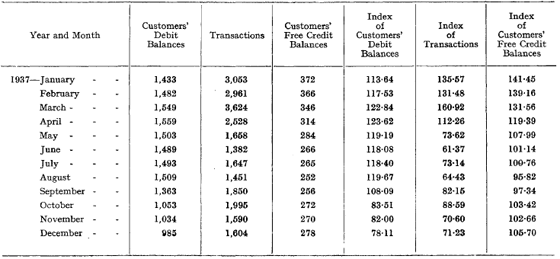
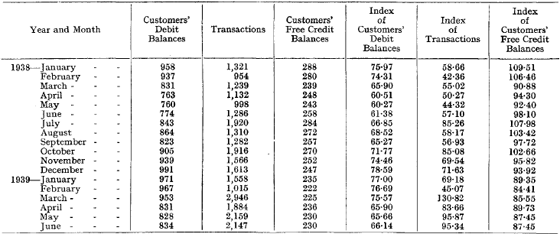
* Beginning from January, 1936, the figures published by the Federal Reserve Board were used. They differ only slightly from those collected by the N.Y. Stock Exchange, as can be seen by comparing the figures for September to December, 1935, from the above series with those reproduced in Table XI.
Sources: For customers’ balances—1932-1935, New York Stock Exchange (unpublished).
1936-1939, Federal Reserve Bulletins.
For transactions—New York Stock Exchange Bulletins.
TABLE XVII
_____
NEW CAPITAL ISSUES FOR THE UNITED KINGDOM, CALL MONEY,
CALL MONEY RATES AND STOCK PRICE INDEX
1922–1939
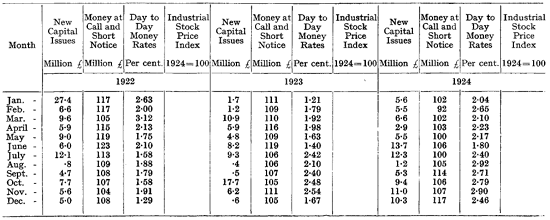
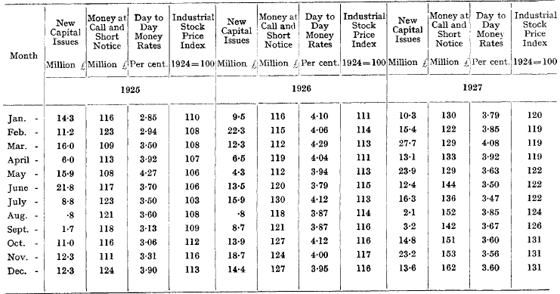
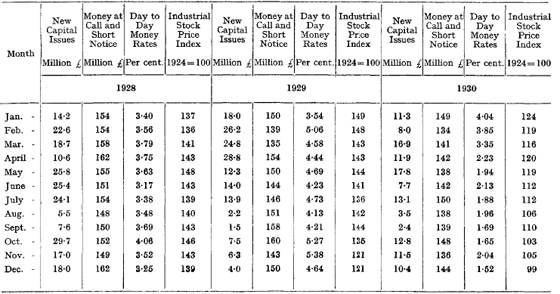
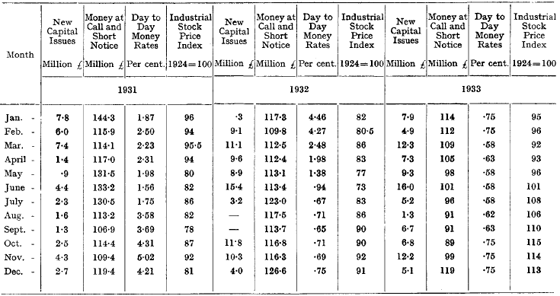
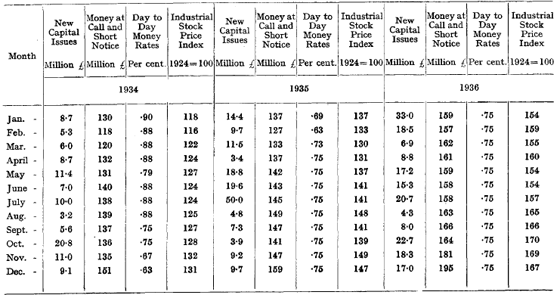
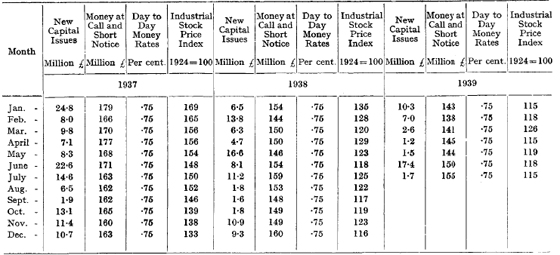
Sources: For New Capital Issues and for Industrial Stock Price Index. London and Cambridge Economic Service, Monthly Bulletins and Special Memorandum No. 33.
For Money at call and at Short Notice and for Money rates, Bank of England, Statistical Summary.
TABLE XVIII.
_____
LOANS OF MONEY AT SHORT NOTICE TO THE STOCK EXCHANGE
AS REPORTED BY THE LONDON CLEARING BANKS
1922–1931
£000
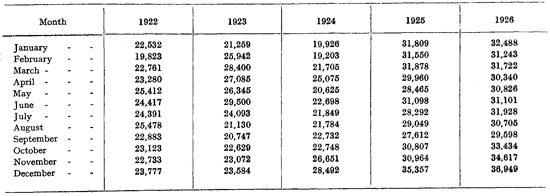
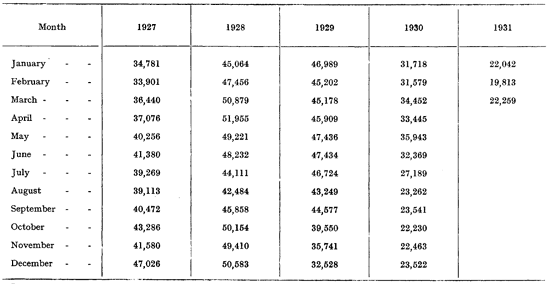
Source:—Report of the Committee on Finance and Industry (MacMillan Report), 1931.

