

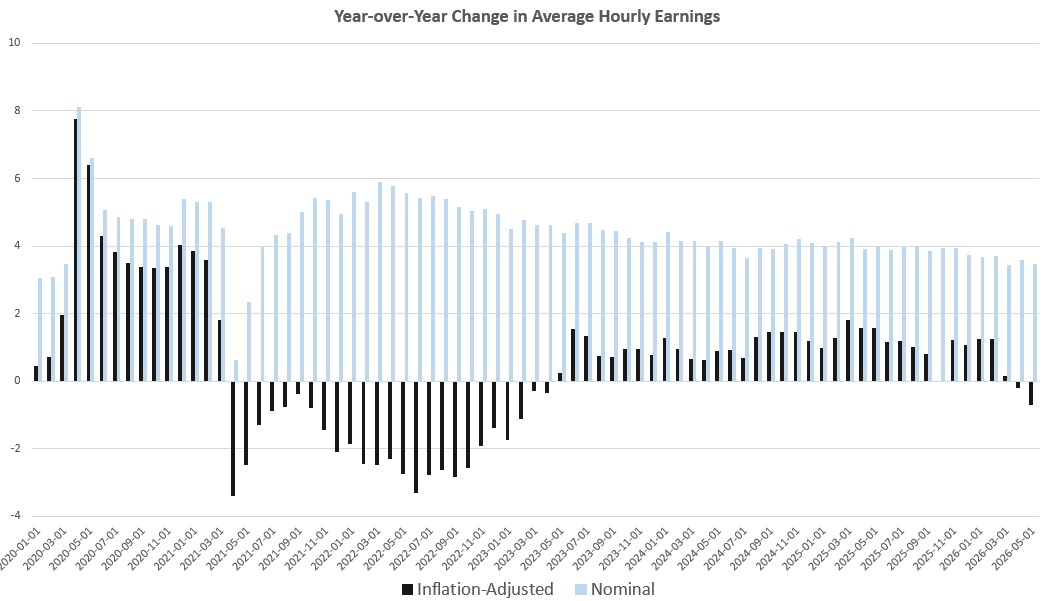
When the BLS released its May employment report earlier this month, one component of the report that raised concerns was the measure of average hourly earnings. In May, the year-over-year change for earnings was at the lowest level measured in nearly five years. Yet, growth was still more than zero, coming in at 3.4 percent. The real problem became more apparent a few days later when the BLS released its May report on price inflation. The new report in prices showed that the year-over-year increase in the CPI was 4.3 percent. You don’t have to be a math genius to see what this means for many ordinary workers: sure, the earnings average was up year over year, but prices increased more than earnings did. In other words, inflation-adjusted wages were actually negative. More specifically, average real earnings fell by 0.69 percent year over year, for May. May also was the second month in a row during which earnings fell, year over year. The last time real earnings fell was back in April of 2023. That was the end of a 25-month period when real earnings fell every month thanks to rising prices. Similar to what we’re seeing now, those drops in real earnings weren’t the result of any collapse in the demand for labor. Rather, real earnings fell back in 2022 and 2023 because price inflation rose to forty-year highs and drove real wage growth down into negative territory.
Notably, the New York Federal Reserve last month warned that CPI inflation—driven partly by rising food prices—will continue to put pressure on consumers. As the Fed report admitted, this is especially those at the low end:
The data on food insecurity was derived from the bank’s long-running Survey of Consumer Expectations, which is most closely watched for its findings about inflation expectations. Survey respondents were asked specifically about food issues in polls done in 2020, 2025 and in February 2026.
Wealthy Americans have been buoyed by rising asset values tied to the stock market, a stable job market and lower home borrowing costs.
Meanwhile, the high inflation pressures that have prevailed since the COVID-19 pandemic have kept pressure on many Americans, as key forms of government support have been in retreat. Much of America’s current economic strength rests on the spending power of the wealthier economic class.
“The bottom of the K-shape represents a significant share of the middle- and lower-income population experiencing elevated levels of economic uncertainty and financial hardship,” the bank’s report said...
Naturally, the Fed has not admitted that it has been a key source the problem. The Fed was at the center of Federal efforts to inflate the money supply by nearly six trillion dollars during the Covid Panic, largely as part of the federal government’s scheme to pay people to stay home and do little more than buy things online during the stay-at-home orders encouraged by the Trump administration.
This led to the multi-decade highs in price inflation that occurred during 2022 and 2023, and we continue to live with the consequences today. In fact, May’s 12-month CPI increase of 4.3 percent, the highest in 38 months, suggests a continued trend upward. )The month-to-month increase, meanwhile, was the third highest increase since mid 2023.)
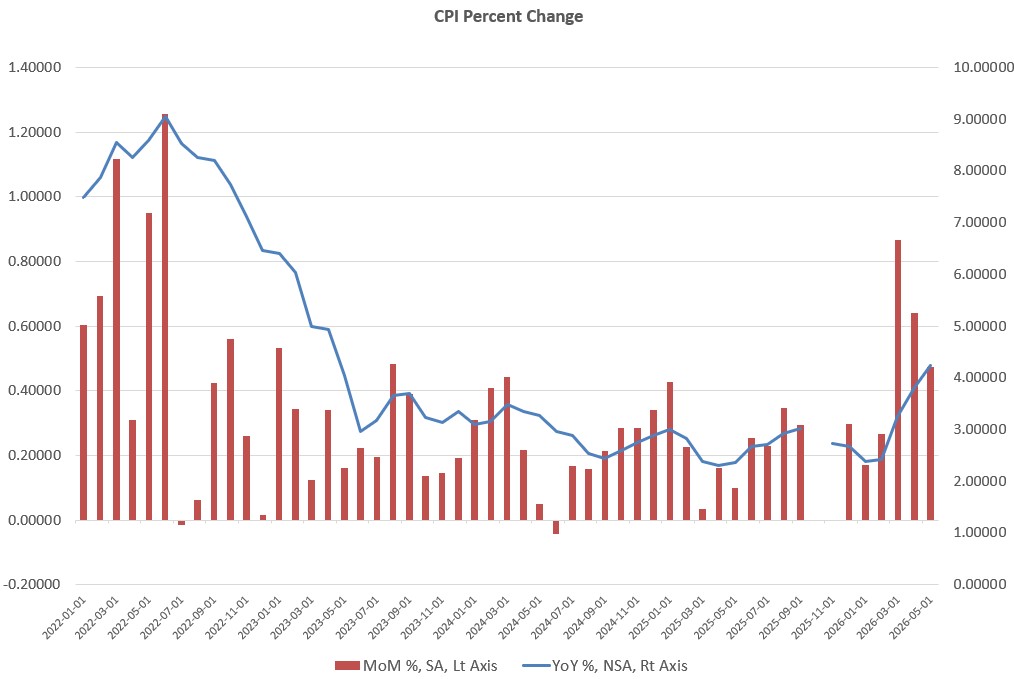
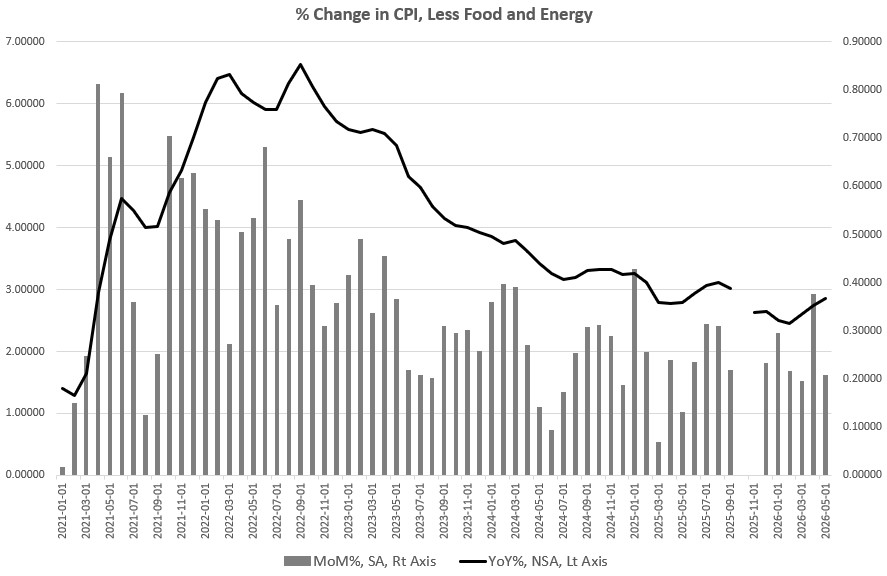
According to the BLS, much of the price growth was driven by fuel prices, which were up, year over year by 23.5 percent in the May report. Food was up by 3.1 percent during the same period. One might then offer the explanation that once the Iran situation calms down, and energy prices return to more “normal” levels, then price inflation will start to fall. This might ring true were it not for the fact that core CPI (i.e., CPI minus food and energy) also shows upward pressure on prices. For example, in May, core CPI growth, year-over-year, hit a nine month high, while month-to-month growth remains firmly in positive territory.
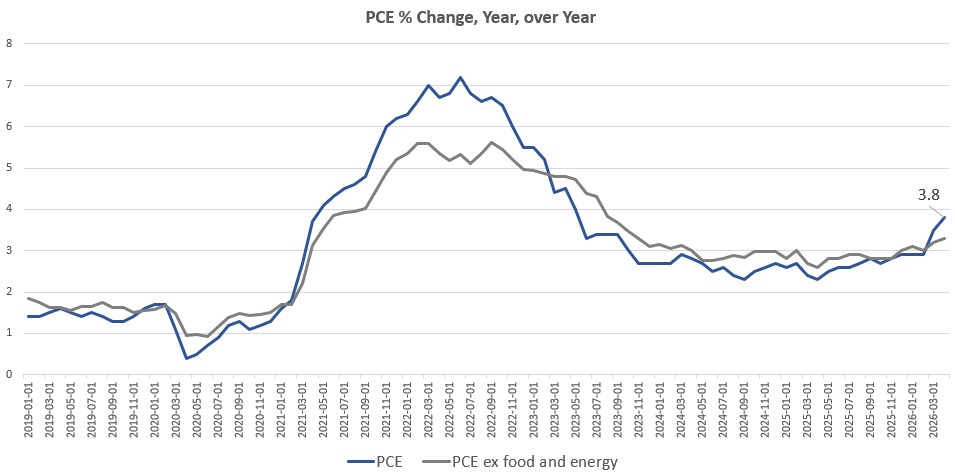
A similar trend also exists with the Fed’s preferred price inflation measure, personal consumption expenditure (PCE). The Fed states that its “target” for price inflation is 2 percent, as measured by the PCE. Yet, the Fed has not hit 2 percent in 62 months, or for more than five years. We don’t yet have May’s PCE measure yet, but April’s PCE increase was 3.8 percent, the largest in 35 months. The core PCE measure showed a similar trend, rising to 3.3 percent. April’s core PCE increase was the largest in 30 months. These new highs in PCE increases come nearly two years after the Fed announced (in September 2024) that price inflation was rapidly returning to the two-percent target. The Fed said this to justify the Fed’s pivot back to forcing down interest rates and buying up assets through, both of which lead to monetary inflation.
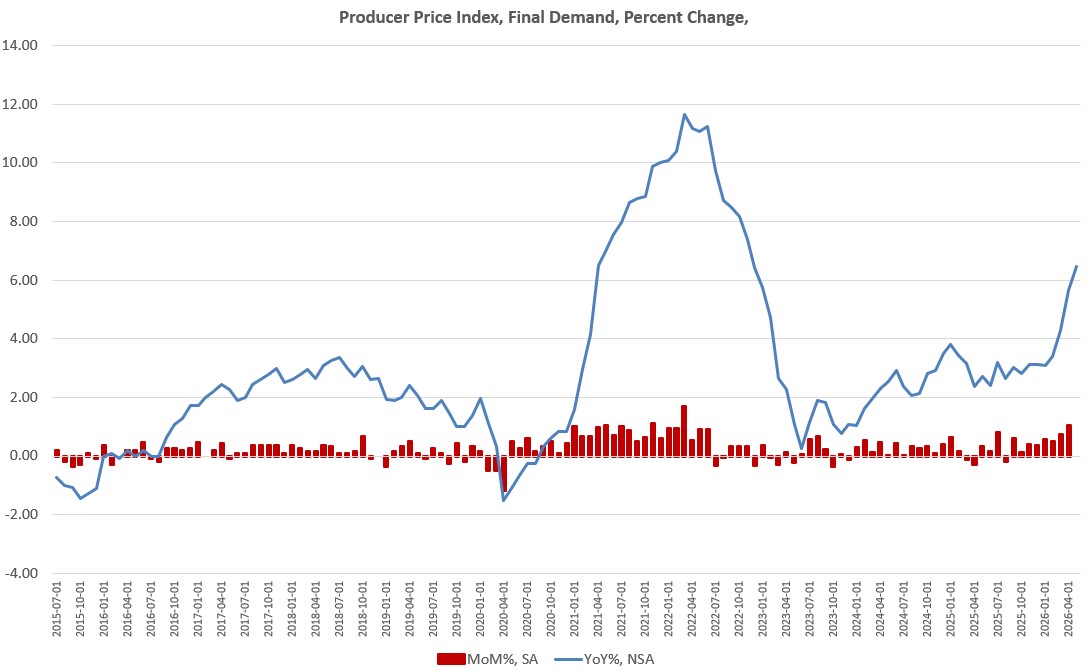
A further indication that the Fed’s two-year-old promise of flattening price increases isn’t coming true any time soon: producer prices soared in May. According to the producer price index (PPI) for May, the year over year increase hit 6.45 percent, the highest in 42 months. These are price increases that producers face. In other words, small business owners and manufacturers are paying much higher prices to get the goods they need to make things or to offer services to consumers. So much for the administration’s promises that more war and more taxes (i.e., tariffs) would somehow make businesses more productive. In reality, the cost of doing business is rapidly rising.
Millions of ordinary Americans now face falling real wages and rising prices for food, fuel, and materials necessary for doing business. This appears to have the most impact on those at the lower income levels, as last month’s Fed report admits. The central bank and the regime overall will attempt to blame all of this on “greed” or the Iranian state, or on some other non-monetary cause. Yet, the fact remains that price inflation comes from monetary inflation as new money floods into the economy and bids up prices across sectors to levels that would not be possible without so-called “money printing.”
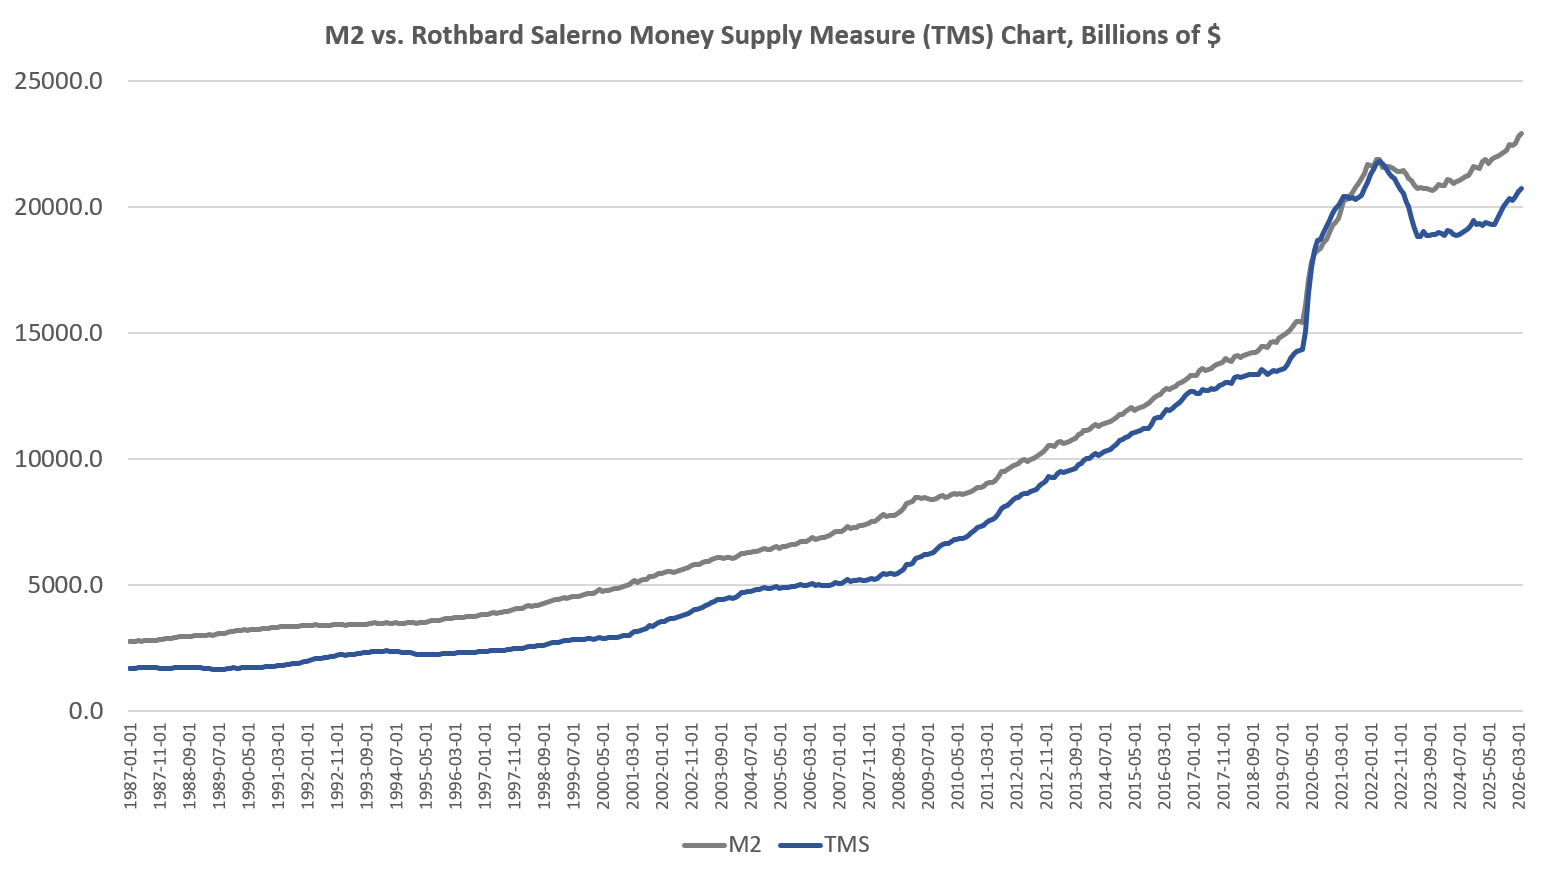
As we look at the continued upward pressure in prices, we should not be surprised by this given that the most recent money-supply data shows that the money supply hit a 49-month high in April, with nearly two-thirds of the total existing money supply have been created just in the past thirteen years. Nearly 26 percent of the total money supply has been created since January 2020. It is true that the price effects of monetary inflation are extremely unpredictable, and it’s always more or less impossible to guess how monetary inflation will trickle out into different sectors of the economy. Will price increase be felt primarily in stocks? Will housing prices soar? Or perhaps food will see the biggest increases? Or, we might see rising prices increase in all these areas of the economy—enabled by system-wide monetary inflation. The details are hard to guess, but as economist Roger Garrison once quipped, “To explain inflation without mentioning the money supply is like explaining the destruction of Pompeii without mentioning the eruption of Mt. Vesuvius.1
Read More:
- April Money Supply Growth Hit a 49-Month High. And Prices Soared.
- The Media Says This Was a “Blowout” Jobs Report. A Closer Look Suggests Otherwise
- 1
This quotation was related to me by economist Roy Cordato.

