The money supply has nearly flatlined in 2025, with July’s total money supply increasing by only $39 billion over the past seven months. The total size of the money supply still remains more than $5 trillion above its pre-covid total—an increase of 35 percent— but trends in delinquencies, employment, and home sales have put downward pressure on the money supply throughout much of 2025.
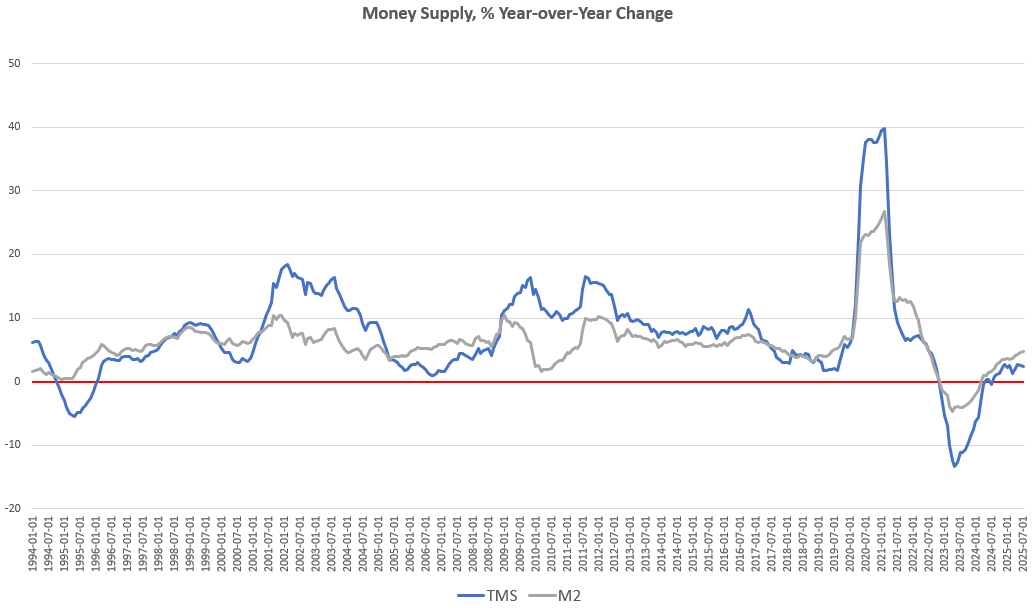
As of July, year-over-year growth in the money supply was at 2.45 percent. That’s down slightly from June’s year-over-year increase of 2.49 percent. Money supply growth is also up compared to July of last year when year-over-year growth was -0.43 percent. The money supply has now increased, year over year, for twelve months in a row, following a very volatile period of immense growth in the money supply—i.e., during 2020 and 2021—followed by eighteen months of sizable declines in the money supply during 2023 and 2024. Since then, however, money supply trends have largely flattened.

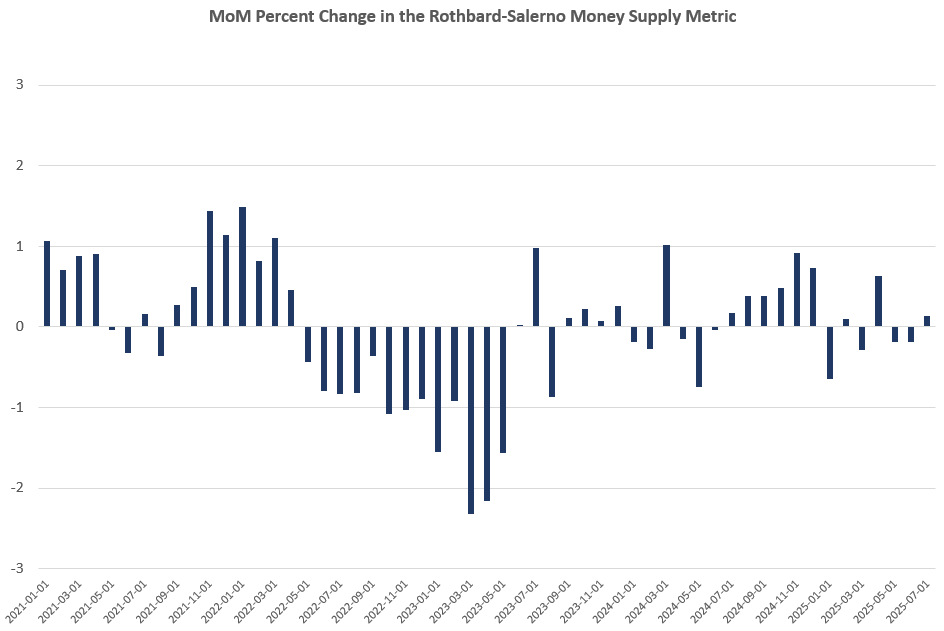
This trend has been especially true in the first half of 2025. Month over month, the money supply in July was up by 0.13 percent, rising only slightly from June’s month-to-month growth rate -0.17 percent. During July of last year, the month-to-month growth rate was 0.17 percent.
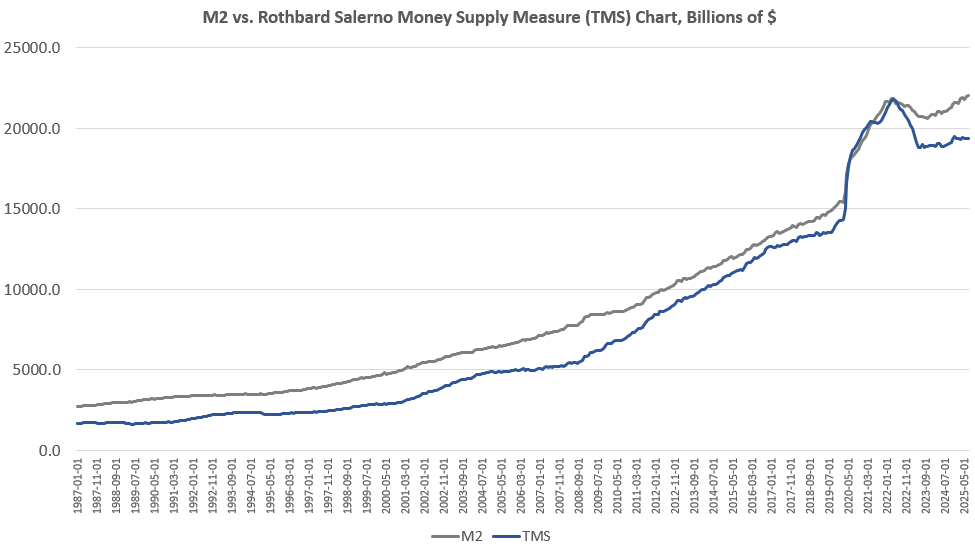
The total money supply has hovered around $19.3 trillion for the past three months, and is little changed from January of this year, rising 0.2 percent, or $39 billion since then.
This flattening of monetary growth likely reflects several trends we now see in the economy. For example, recent employment reports have shown that job growth has largely stalled, and July’s revisions to employment totals suggest that employment trends are worse than was previously thought. Moreover, recent reports from the Federal Reserve Bank of New York shows that delinquencies on student loans, auto loans, and credit cares are all at or above the levels they were during the Great Recession. Meanwhile, bankruptcies are up by more than 11 percent in 2025 compared to last year, and pending home sales continue to fall.
All of these trends are likely to have an effect on money supply growth. As Frank Shostak has explained, the money supply will often grow along with loan activity at commercial banks, and increases in loan activity requires an abundance of credit-worthy borrowers. As delinquencies and bankruptcies rise—a trend made worse by stagnating employment—the number of available borrowers falls. Fewer loans will then be made and the money supply will grow less swiftly. On the other end, a growing number of defaulting borrowers means previously lent dollars will “disappear” as these loans are never paid back, putting downward pressure on the overall money supply. As home-sale totals fall, this also tends to mean fewer newly lent dollars entering the economy.
All of this together is a recipe for diminishing growth in the money supply. When combined with the Fed’s recent reluctance to lower the target policy interest rate—which has meant fewer monetary injections from the Fed’s open market operations— we’re now seeing a flattening in the overall money supply.

The money supply metric used here—the “true,” or Rothbard-Salerno, money supply measure (TMS)—is the metric developed by Murray Rothbard and Joseph Salerno, and is designed to provide a better measure of money supply fluctuations than M2. (The Mises Institute now offers regular updates on this metric and its growth.)
Historically, M2 growth rates have often followed a similar course to TMS growth rates, but M2 is now growing considerably faster than TMS, and a gap between the two measures has gradually widened. In July, the M2 growth rate, year over year, was 4.79 percent. That’s up from June’s growth rate of 4.51 percent. July’s growth rate was also up from July 2024’s rate of 1.54 percent. Month over month, M2 has also grown faster than TMS, rising by 0.33 percent from June to July.
Although year-over-year and month-to-month growth rates may be moderating, money-supply totals remain far above what they were before 2020 and the covid panic. From 2020 to 2022, the Federal Reserve’s easy-money policies resulted in approximately 6.4 trillion dollars being added to the economy. This was done to help to finance the federal government’s enormous deficits driven by runaway covid stimulus programs. Although the total size of the money supply has fallen since mid 2022, it has certainly not fallen enough to return money supply growth to the pre-covid trend, and the total money supply as of July remains five trillion above where it was at the beginning of 2020.

Since 2009, the TMS money supply is now up by nearly 194 percent. (M2 has grown by nearly 156 percent in that period.) Out of the current money supply of $19.3 trillion, nearly 26 percent of that has been created since January 2020. Since 2009, in the wake of the global financial crisis, more than $12 trillion of the current money supply has been created. In other words, nearly two-thirds of the total existing money supply have been created just in the past thirteen years.
As a result money-supply is now well above the former trend that was in place before 2020. For example, just to get to back to the money-creation trend that existed in 2019 before the “great covid inflation,” total money supply would need to fall by at least three trillion dollars.
Why Is There a Growing Gap Between M2 and TMS?
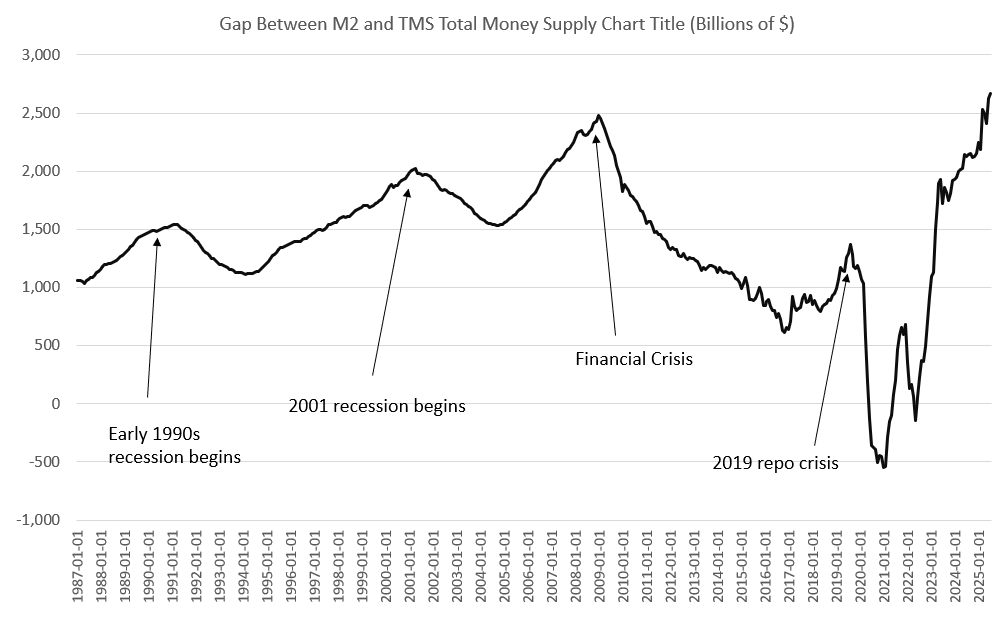
But why is there a growing gap between M2 and TMS, and does it mean anything? To answer the first part of this question we need to consider how M2 is calculated differently from TMS. First, TMS includes Treasury deposits at Federal Reserve banks, while M2 does not. These deposits have fallen by nearly $200 billion since January. This has brought down TMS totals, but has not directly reduced M2. Moreover, M2 does include retail money funds while TMS does not include these funds as money. So, with retail money funds increasing by more than $100 billion since January we’re seeing more upward pressure on M2 than on TMS. These are just two factors that are helping to form an ongoing gap between M2 and TMS.
Does this gap matter? Historically, a large and growing gap between M2 and TMS has suggested in several cases that the US economy has already entered a recession. Looking back to the months before the onset of recession in 1990, 2001, and 2007, we find that the gap between TMS and M2 was near a new peak in each case. A similar phenomenon happened in late 2019 along with the repo crisis of that year. This was likely a prelude to a 2020 recession that would have happened had the central bank not intervened to push extreme levels of new liquidity during the covid panic. Now, in mid 2025, this gap is now the largest it has been in decades—and possibly ever.

This doesn’t prove that the US is in the midst of a recession at the moment, but the growing gap between M2 and TMS suggests that the US is, at least, entering a period of serious economic weakness.


