What You Should Know About Inflation
4. A Twenty-Year Record

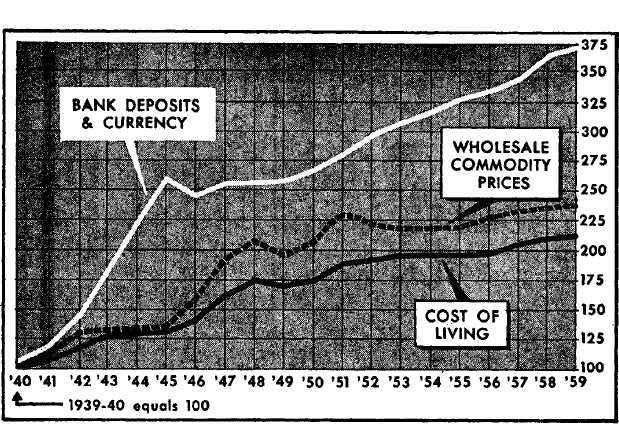
I present in this chapter a chart comparing the increase in the cost of living, in wholesale commodity prices, and in the amount of bank deposits and currency, for the twenty-year period from the end of 1939 to the end of 1959.
Taking the end of 1939 as the base, and giving it a value of 100, the chart shows that in 1959 the cost of living (consumer prices) had increased 113 per cent over 1939, wholesale prices had increased 136 per cent, and the total supply of bank deposits and currency had increased 270 per cent.
The basic cause of the increase in wholesale and consumer prices was the increase in the supply of money and credit. There was no “shortage of goods.” As we noticed in the preceding chapter, our rate of industrial production in the twenty-year period increased 177 per cent. But though the rate of industrial production almost tripled, the supply of money and credit almost quadrupled. If it had not been for the increase in production, the rise in prices would have been much greater than it actually was.
Nor, as we also saw in the last chapter, can the increase in prices be attributed to increased wage demands—to a “cost push.” Such a theory reverses cause and effect. “Costs” are prices—prices of raw materials and services—and go up for the same reason as other prices do.
If we were to extend this chart to a total of 24 years—that is, to the end of 1963—it would show that, taking 1939 as a base, the cost of living increased 124 per cent, wholesale prices increased 136 per cent, and the total supply of bank deposits and currency increased 360 per cent in the period.