What You Should Know About Inflation
35. Deficits vs. Jobs

I pointed out in the last chapter that, after 1930, we had cheap money, inflexible or rising wage-rates, and heavy government deficits for the next ten years. As a result, we also had mass unemployment for the next ten years—until World War II finally bailed us out.
Inasmuch as today, in every slump or lull, we are being urged to adopt precisely the remedies that failed in the ’30s, it may pay us to look at that period in more detail. The deficits, number of unemployed, and percentage of unemployed to the total labor force are tabulated, year by year, in that decade.
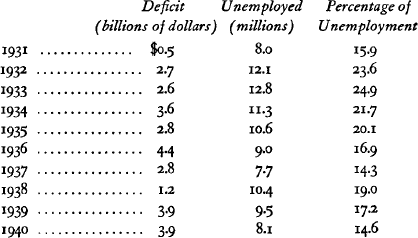
In the tabulation the deficits are for fiscal years ending on June 30; the unemployment is an average of the full calendar year. Spenders, no doubt, will try to find a partial negative correlation between the size of the deficit and the number of unemployed; but the central and decisive fact is that heavy deficits were accompanied by mass unemployment. If we translate the figures into 1959 terms, we find: The average deficit in this ten-year period was $2.8 billion, which was 3.6 per cent of the gross national product of the period. The same percentage of the gross national product of 1959 would mean a deficit of $17.3 billion. The average unemployment of the ten-year period was 9.9 millions, which was 18.6 per cent of the total labor force. The same percentage of unemployment today would mean 13.4 million jobless. So much for the effect of deficits as a cure for unemployment.
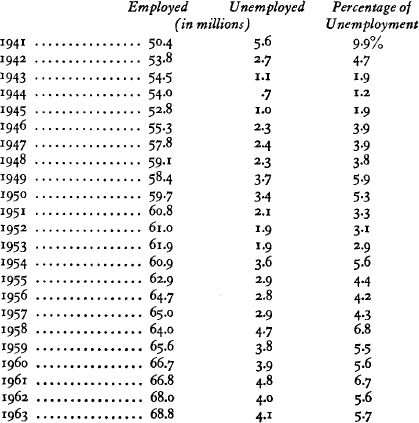
At the end of this chapter the table is continued from 1941 through 1963. It will be noticed that we did, in 1944, get unemployment down to a low point of only 1.2 per cent of the working force. If this is to be attributed to deficit spending, then we must notice that it took a $51.4 billion deficit to do it. Compared with the increase in the gross national product, this would have to be a deficit today of more than $145 billion! (However, the deficits in both 1943 and 1945 were even larger than in 1944; and yet unemployment was also larger in those years.)
Another point to be noticed in this table is that in the ten years from 1948 to 1957 inclusive, average unemployment was 4.3 per cent of the total labor force. Yet this period was one of unusually high employment, even of “labor shortage.” But if four persons out of every 100 are “normally” unemployed, “abnormal” unemployment is only the excess above this. Such unemployment is serious, especially for those directly concerned. But it hardly justifies reckless deficit spending or further dilution of the dollar in an effort to cure it. We could more profitably look, in times of abnormal unemployment, at the relation of key wage rates to prices and consumer demand.
THE RECORD