

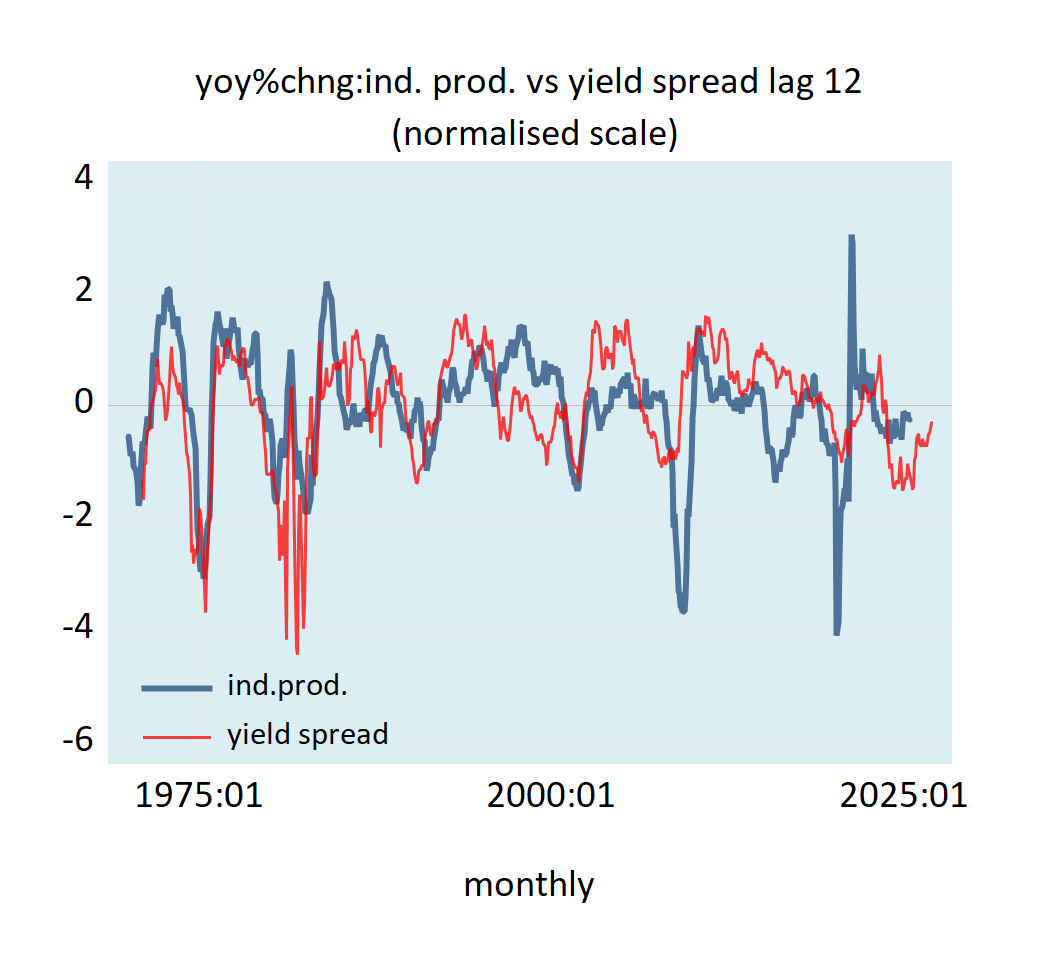
Most economic commentators consider the differential, also known as the yield curve, between the long-term and the short-term interest rates as an important indicator for the establishment of the future course of economic activity. An increase in the yield curve is seen as pointing towards good economic times ahead. Conversely, a declining yield curve increases the likelihood of an economic recession. In the US, historically, the differential between the yield on the 10-year T-Bond and the federal funds rate was leading the yearly growth rate of industrial production by 12-months (see chart).
Now, a good visual correlation between the yield curve and economic activity does not, however, explain why the yield curve is a good predictor of economic activity. The correlation only describes, it does not explain.
A popular explanation for determination of the shape of the yield curve is provided by the expectations theory (ET). According to the ET, the key to the shape of the yield curve is that long-term interest rates are the average of the present and the expected short-term interest rates. Thus, if today’s one-year rate is 4 percent and the next year’s one-year rate is expected to be 5 percent, then the two-year rate today should be 4.5 percent—(4+5)/2=4.5. Here the long-term interest rate (i.e., the two-year rate today) is higher than the present short-term interest rate (i.e., one year) rate.
It follows, then, that expectations for increases in the short-term interest rate will make the yield curve upward sloping, as the long-term interest rate is higher than the short-term interest rate. Equally, expectations for a decline in the short-term interest rate will result in a downward-sloping yield curve, as the long-term interest rate is lower than the short-term interest rate.
If today’s one-year interest rate is 4 percent, and the next year’s one-year interest rate is expected to be 3 percent, then the two-year interest rate today should be 3.5 percent—(4+3)/2=3.5. The long-term interest rate (i.e., the two-year interest rate today) is lower than the present short-term interest rate.
According to the ET framework, whenever investors expect economic expansion, they are likely to start anticipating rising short-term interest rates. Consequently, the long-term interest rate will be higher than the short-term interest rate, hence, an upward-sloping yield curve emerges. Conversely, an economic slump is associated with the expectations for a declining short-term interest rate. As a result, according to the ET, the long-term interest rate today will be lower than the short-term interest rate—a downward-sloping yield curve emerges.
The Shape of the Yield Curve in an Unhampered Market
In his writings, Ludwig von Mises concluded that—in a free, unhampered market—the natural tendency of the shape of the yield curve is neither towards an upward-sloping nor towards a downward-sloping but rather towards flattening. On this Mises wrote,
The activities of the entrepreneurs tend toward the establishment of a uniform rate of originary interest in the whole market economy. If there turns up in one sector of the market a margin between the prices of present goods and those of future goods which deviates from the margin prevailing on other sectors, a trend toward equalization is brought about by the striving of businessmen to enter those sectors in which this margin is higher and to avoid those in which it is lower. The final rate of originary interest is the same in all parts of the market of the evenly rotating economy.
Also, Murray Rothbard held that—in a free, unhampered market economy—an upward-sloping yield curve cannot be sustained because it would set in place an arbitrage between short- and long-term securities. This would lift the short-term interest rates and lower the long-term interest rates, resulting in the tendency towards a uniform interest rate. Arbitrage will also prevent the sustainability of a downward-sloping yield curve by shifting funds from long maturities to short maturities thereby flattening the curve. Hence, in a free, unhampered market economy an upward or a downward-sloping yield curve cannot be sustained.
What then is the mechanism that generates a sustained upward or a downward-sloping yield curve? The shape of the yield curve is the outcome of the Fed’s monetary policies.
How the Fed Tampering Generates an Upward or Downward-Sloping Yield Curve
While the Fed can exercise control over the short-term interest rates via the federal funds interest rate, it has a lesser control over the longer-term interest rates. The Fed’s interest rate policy disrupts the natural tendency towards the uniformity of interest rates. This leads to the deviation of short-term interest rates from individuals’ time preferences as partially mirrored by the relatively less-manipulated, long-term interest rate.
When the Fed lowers the policy interest rate target, this almost instantly lowers the short-term interest rates, while—to a lesser extent—affecting the longer-term interest rates. As a result, an upward-sloping yield curve develops. (The interest rate differential between the long-term interest rate and the short-term interest rate widens). Conversely, when the Fed reverses its stance and lifts the policy interest rate target this lifts the short-term interest rates. As a result, a downward-sloping yield curve emerges. (The differential between the long-term interest rate and the short-term interest rate narrows).
The deviation of the short-term interest rates from long-term interest rates falsifies the signals issued by consumers to producers. This, in turn, ends in the misallocation of resources and economic impoverishment. Consequently, producers generate products that are not in line with consumers’ preferences. For instance, the Fed lowers its policy interest rate to encourage an expansion in the production structure; however, this is contrary to consumers’ time preferences. This means that consumers did not allocate an adequate amount of savings. Hence, producers do not have enough savings to undertake the expansion of the infrastructure. Consequently, the whole thing will end in an economic bust.
Observe that, by the ET framework, it is not individuals’ time preferences that determine interest rates but the central bank. By the ET framework, the central bank, through its interest rate policy and expectations regarding the interest rate policy, sets the long-term interest rates. Hence, according to the ET framework, the central bank is a major factor in setting interest rates.
Why Do Changes in the Shape of the Yield Curve Precede Economic Activity?
Whenever the central bank reverses the interest rate stance, which alters the shape of the yield curve, this sets in motion either an economic boom or an economic bust. These booms and busts do not arise immediately. The reason for this is that the effect of a change in the interest rate policy shifts from one market to another market.
For instance, during an economic slump, the central bank lowers the policy interest rate. Consequently, a steepening of the yield curve emerges. This, however, has a minimal effect on economic activity, which is still dominated by the previous tight interest rate stance. It is only later on, once the easy money stance begins to dominate the economic scene, that economic activity starts increasing. Now, if private savings are declining, then—notwithstanding the increase in the yield curve—economic activity is likely to remain under pressure. Hence, the historical correlation between the yield curve and economic activity will provide misleading readings.
Summary and Conclusion
Historically, in the US, there was a good visual correlation between the yield curve and economic activity. However, these correlations can only describe but not explain. Economic bust is likely to emerge notwithstanding an upward-sloping yield curve if private savings are in trouble. The popular ET framework, based on historical correlations between the lagged yield curve and economic activity, cannot provide a trustworthy explanation regarding the boom-bust cycles.

