

Volume 13, Number 1 (Spring 2010)
ABSTRACT: It is common to assume in business cycle analysis that the capital stock is homogenous and constant in aggregate value. We explore the alternative concept that capital is heterogeneous, and whether it exhibits cyclical changes. A multi-period model of investment implies that acquisition of specific components of capital responds to changes in relative interest rates, and we further show that the structure of rates is cyclical. If cyclical changes in the composition of capital are substantial, that is another mechanism to propagate the business cycle. Detailed data of specific capital types are available for US passenger airlines, a cyclical industry. We find that there are regular patterns by which airlines adjust the mix of capital. Results suggest a capacity constraint influence in determining movements of aggregate income.1, 2
INTRODUCTION
The assumption of a fixed capital stock for short-run macroeconomic analysis is common and considered reasonable. While simplifying assumptions facilitate development of hypotheses, they can also hinder or distort the explanation of behavior. Aggregate investment expenditure by firms is cyclical and volatile, and those characteristics have long been central to explanations of business cycle movements in output. In cyclical analysis, investment flows are assumed to be of small enough magnitude that neither the total value of capital nor its composition affects aggregate economic activity. Whether the composition of capital stock varies systematically, and by how much, are empirical questions, and should be considered before assuming capital stock to be fixed. If the composition varies cyclically, we should understand why, and what that may contribute to the explanation of the variation of aggregate income through a business cycle.
By comparison, our understanding of the aggregate labor market improved with the analysis of Davis, Haltiwanger and Schuh (1997) and subsequent research. They found several “basic facts” about how aggregate employment changes over a business cycle and also in the long run, such as: flows of job creation and job destruction are large, job destruction is more cyclically volatile than job creation, and that changes in job aggregates are persistent. We consider these same issues for capital markets. Behind the growth of total capital over time are flows of increases and decreases in the components of the stock. Capital is created by investment, and destroyed by depreciation, technical obsolescence, change in demand for the product or service, regulation and other factors. Are these flows cyclical, persistent and substantial in magnitude, or may we continue with a reasonable assumption that capital is fixed?
This paper provides a framework for the question of whether a heterogeneous capital stock can influence cyclical changes in aggregate income. First we present a multiperiod model of investment in which decisions are made about more than one type of capital good. These decisions have long reaching consequences for the amount and type of capital used in an industry. We show that investment flows for different components of capital are differentially influenced by changes in interest rates. If interest rates exhibit cyclical behavior, the relative price influence results in cyclical movements in components of capital stock through investment flows and the later conversion of capital types. Finally, we explore capital stock composition and how it relates to cyclical changes in real GDP using the example of a cyclical industry, U.S. passenger airlines.
MOTIVATION AND PREVIOUS RESEARCH
In addition to its role in aggregate demand, investment alters the magnitude of capital stock over time, and aggregate supply. Relative factor proportions of capital and labor are a vital mechanism in Real Business Cycle and Austrian models of cycles. Typically through random shocks or trends, changes in capital stock affect the capacity limitations on aggregate supply. McCulloch (1981) showed that the composition of capital stock also imposes capacity limitations on future production possibilities. If the influences on investment, both in amount and composition, are cyclical then capital stock may be a mechanism that propagates the business cycle.
As a Federal Reserve Board member, Ben Bernanke commented on the role of capital in business cycle behavior. He noted that during the recovery from the 2001 recession, firms and households engaged in “restructuring and rationalizing their balance sheets,” by using low interest rates to refinance mortgages, paying off consumer debt, and by “firms lengthening the maturity of their debts” and lowering “their interest-to-earnings ratios” (Bernanke, 2003b). He also suggested that capital overhang, to the extent that it exists, is localized in a few industries and “probably not a major negative factor for investment in the broader economy” (Bernanke, 2003a).
The Economic Report of the President 2004 (Council of Economic Advisors, 2004) began with a chapter on “Lessons from the Recent Business Cycle,” and the first was that “Structural Imbalances Can Take Some Time to Resolve.” The Report described the “surge” in investment during the 1991-2001 U.S. economic expansion as concentrated in high-tech industries such as “computers, software and telecommunications.” It attributed the rapid increase in policy encouraging investment, to overly optimistic expectations about earnings, and to actual technological change.
Such an excess of existing capital stock relative to the desired stock (often called a capital overhang) is one type of structural imbalance that can slow or reverse economic expansion. In the case of an excess supply of capital, investment would be expected to slow until the capital overhang dissipates through a combination of depreciation in the existing stock and an increase in the desired stock due to lower costs of capital or stronger final demand (Council of Economic Advisors, 2004, p. 35).
Their Chart 1-2 shows the slower pace of “Real Investment in Equipment and Software” in the last recession compared to recessions on average, and characterizes that as a “distinctive feature of this business cycle” (Council of Economic Advisors, 2004, p. 35). These statements imply that policy makers view the amount and composition of the capital stock to be an important component of the explanation of the business cycle.
If all capital has certain common characteristics, it has no role in determining business cycle changes in output. Identifiable components of capital such as broad categories of equipment and structures, may be close enough substitutes to be aggregated into a capital factor index (Berndt and Christensen, 1973). If so, the composition would matter little. Even if there are identifiable components of capital, they may exhibit no clear or recurring cyclical behavior. The existence of random sectoral shocks to productivity could account for the variations in capital composition with little relation to aggregate cyclicality. Capital heterogeneity may be inconsistent over time, without distinct, lasting components if technological change is non-neutral in effects on the productivity of capital components. The change in the capital composition may not be large enough to account for business cycle movements in income. Identifiable components of aggregate capital may matter little for determining the level of aggregate supply.
A common assumption in business cycle analysis is that capital is homogeneous, though the amount is cyclical. The following examples illustrate the nature of the arguments against a role for heterogeneous capital. Olivier Blanchard (1990, p. 780) suggested that
even with competitive markets, full information and flexible prices, the neutrality proposition is only an approximation. Any anticipated change in nominal money must lead to anticipated changes in the price level, and thus introduce a wedge between the opportunity cost of holding money and the cost of capital; in all cases this will affect utility and in most cases is likely to affect capital accumulation as well [see Fischer (1979) and Chapter 6 by Orphanides and Solow in this Handbook]. Even unanticipated changes, if they are the result of open market operations, are likely to be non-neutral: open market transactions will usually involve some but not all holders of money and have distribution effects [see Rotemberg (1984) and Grossman and Weiss (1983)]. But, except for the effects of steady inflation which may be substantial (especially when the non-neutrality of the tax system is taken into account), these effects are mere intellectual curiosities; they can account neither for the size nor for the shape of the effect of money on output.
Gordon Tullock argued that changes in capital components would have a small effect on output;
…[M]ostly what takes time is building the factory, not the actual production once the factory is completed. …[T]he interest rate is of great significance in deciding whether or not to build a new factory, buy an expensive machine, etc., but of very little significance in deciding how much to produce in an existing factory (Tullock, 1987, pp. 74-75).
And,
First, a good deal of productive capital will in fact have been inherited from the period before the government began to drive interest rates down. This is particularly true with such things as buildings and ships which are long and hard to produce, but it will also be true with much other equipment. There is no reason why this machinery should be particularly damaged by what has happened, nor is there any reason to believe that there is too much of it under the current circumstances. The second issue would be with those new capital investments made during the period of the artificially depressed interest rate and those that have been completed.… Consider those factories (factories designed for consumer products) that have not yet been finished when the interest rate rises. Whatever has already been built is once again a sunk cost, a cost that should be ignored in deciding whether or not the machinery or factory should be finished.… The number of factories, apartment buildings, ships, etc., left incomplete because the operation had not gotten far enough along so that it was still profitable to complete them, would have been a fairly small part of the total new equipment acquired… (Tullock, 1987, p. 75).
Krugman (1998) asserted that the only reason for a “capital overhang” to cause recession is an assumed friction in resource employment;
…[N]obody has managed to explain why bad investments in the past require the unemployment of good workers in the present …[T]he best that von Hayek or Schumpeter could come up with was the vague suggestion that unemployment was a frictional problem created as the economy transferred workers from the bloated investment goods sector back to the production of consumer goods.
These statements suggest that a reasonable approximation is to consider capital as an aggregate and constant in the short-run period of a business cycle. To explore other possibilities, we assume that capital stock is heterogeneous, composed of equipment or structures that have specialized uses and function in structural relation (Mises, 1971 and Hayek, 1935). Investment in particular forms of capital stock may be irreversible or costly to change (Pindyck, 1991), so that decisions in the present period have long-lasting effects on the size and composition of capital stock. Then, capital structure as it determines production possibilities, could be a means by which cyclical influences are transmitted with persistence through the economy. The purpose of this paper is to consider whether capital stock components exhibit cyclical changes, and whether these changes are substantial enough to operate as a mechanism for business cycle movements in aggregate output.
A MODEL OF CAPITAL STOCK COMPOSITION
A distinctive characteristic of Austrian Business Cycle theory is that the composition of the capital stock changes systematically through the business cycle. The business cycle may have several causes, monetary and real, but the propagation mechanism in the Austrian theory is through variation in the composition of capital in terms of distinctive types of capital. The variations are not random or benign, but cyclic, inefficient and constraining. Early on the concept of “malinvestment” was identified by Mises (1971, p. 364), to characterize the use of resources to acquire specific types and quantities of capital that later proved less productive than other available allocations. The recession phase of the business cycle is also driven by liquidation of capital (DeLong, 1991) as firms realize past errors. If the errors in acquiring the various types of capital have persistent effects, they may constrain the ability of firms to supply the product in the future.
Capital stock may be characterized as “heterogeneous and multiply specific” (Mulligan, 2006, p. 316). Two or more “types” of capital may exist within the capital stock of a firm, used in a production process. To differentiate the types, we suppose that they have different marginal products, that some might be related as substitutes and others as complements, and that there is not a single common elasticity of substitution between types. Mises proposed that capital, once it has been installed, is characterized as “inconvertible” (Mises, 1960, p. 218) between uses at a later date.
When the interest rate changes, affecting the cost of capital, firms alter the rates at which they acquire new capital and dispose of existing capital. The change in interest rates may have several causes, but an important source of business cycles is central bank policy. As the economy approaches recession and in recession, typical policy is to effect a lower interest rate to stimulate demand for new capital goods. If demands for different types of capital have different interest rate elasticities, then the composition of the heterogeneous capital stock is altered over the course of the business cycle. The change in capital stock is not random, but systematically related to the cost of capital.3 As interest rate levels and their term structure are restored later in the cycle, the economy experiences a recession. Actual capital stock, given the past choices of investment, is unable to produce the level and composition of goods and services that we characterize as a natural gross domestic product. McCulloch’s graph model (1981, pp. 111-113) showed how malinvestment acts as a supply constraint, resulting in recession.
This section of the paper offers a model of the firm to explain why a heterogeneous capital stock changes in structure, in a systematic manner over a business cycle. We rely on several working assumptions, such as a heterogeneous capital stock, that capital is inconvertible, that demands for capital types respond systematically to interest rate changes, and the existence of a liquidity effect in credit markets. The purpose is to specify the propagation mechanism by which interest rate changes generate the business cycle through supply.
The composition of the capital stock may be modeled in several forms of heterogeneity. A vintage model (such as Caballero and Hammour, 1994) specifies real GDP supplied by labor and complementary capital of different ages. A general production function is:
(1)
where Yt is real GDP supplied, F is the production function, Nt is the current flow of labor resources, and Kt is the stock of capital of vintage t, with the flow of services assumed to be proportional to the stock. Alternatively, the capital stock is heterogeneous in specialized types of capital, and equipment, software and structures are designed for a narrow range of functions, and we may expect their productivity to decrease as they are employed for alternative uses. Scarth (1996, pp. 5-10) offered a multi-period model of the firm to concentrate on investment demand over time. We ignore Scarth’s adjustment cost for new capital, and extend capital to two defined types. Firms are subject to the constraint of the production function, and an assumed constant market price of the product. The objective of the firm is to maximize the present value of the net revenue generated by the employment of capital and labor resources. The capital acquisition equations are familiar as existing capital depreciates at rate δ and new capital is added with I, investment. The model is:
(2)
(3)

where r is the real interest rate, t is an index for the time period, P is the price of the good being produced, N is labor services, W is the wage rate, PI is the price of investment goods which for simplicity is the same for both types of capital, IL is investment in long-term capital and IS is investment in short-term capital. The capital accumulation equations are:
(4)
(5)
where δ is the depreciation rate. Firms choose values of N, KL, KS, IL and IS given the prices, interest rate, and depreciation rate. We specify KS as a type of capital with a relatively short time period between the application of the capital and the availability of the product, and KL as capital with a long period in the production process. A framework of flow input and point output is appropriate here, with the additional feature that different types of capital are applied at different times in the flow of inputs; first KL, and later KS. Given the limited time dimension of the capital acquisition equations, only terms involving t-1, t and t+1 are relevant. To find the first order conditions for the model, we solve the capital accumulation equations for IL and IS and substitute the constraints into the equation for PV, then take the first derivatives with respect to N, KLt, KSt. Assume that PI = 1, that derivatives for periods other than t-1, t and t+1 are zero, and multiply through by (1+r)t. The first order conditions are:
(6)
(7)

(8)

If r and δ are the same for both types of capital, the expressions for marginal products of KL and KS are the same. The values of r and δ might differ under certain conditions. Depreciation rates may well vary for different types of capital.4 Or, relevant interest rates may differ if firms finance different types of capital in more specific capital markets. In an economy in long-run equilibrium, short-term and long-term interest rates are related by the Expectations Hypothesis in a term structure (Fisher, 1896). The Preferred Habitat theory extends the Expectations Hypothesis to include preferences by investors for borrowing at certain terms to maturity, while recognizing that bonds of different maturities may be substitutes (Modigliani and Sutch, 1966). In long run equilibrium, the interest rates at different terms need not all be equal. If there are preferences by the firm to match the term of borrowing with the time involved in the production process, then the interest rate that is relevant for long-term capital will exceed that of the interest rate for short-term capital. Regardless, the value of the marginal product equals the cost of capital, composed of the interest and depreciation rates.
The composition of the capital stock can change over the business cycle if firms alter their relative investment flows in types of capital, or if they retire capital at different rates. A standard cost minimization framework for this model results in factor demand function for each factor in terms of the level of output, all factor prices, the wage rate, and the cost of capital. For the two types of capital, the expressions for demands for capital are:
(9)
(10)
As is well known, the own-price response is negative:
(11)

where H is the bordered Hessian of the system. Then Hii is a principal minor, which determines the sign of the expression, and Hii is composed of marginal products of the factors and second partial derivatives; Fi, Fii, Fjj and Fij. The principal minors for capital types KL and KS are:
(12)

(13)

If we assume that different types of capital can be distinguished, then marginal products (FKL and FKS) and second derivatives (FLKL, FLKS, FKLKL and FKSKS) will differ by capital type, and consequently the own-price response will differ. A change in interest rates will have the effect of altering relative capital demands, as determined by the elasticities of substitution between factors (Ferguson, 1966, pp. 459-460). The composition of the capital stock is affected by changes in interest rates.
Fig. 1. Slope of the Yield Curve 1954–2009

There has been accumulating evidence that interest rates are cyclical, especially with regard to the term structure. Interest rate spreads, the actual difference between long-term and short-term market rates, have consistently appeared as significant in predicting the phase of the business cycle.5 Figure 1 displays the slope of the yield curve in terms of the 3-month U.S. Treasury bill rate and the 10-year U.S. Treasury bond rate for 1954: Q1-2009: Q1 (Federal Reserve Bank of St. Louis, 2009). The average of ten business cycles are shown from trough to trough, with peak time periods for the cycles aligned. The maximum and minimum slopes across all ten cycles are shown for each time quarter. At the start of expansions, the yield curve is consistently steep, with a large positive slope. Through the expansion, short-term rates rise relative to long-term rates and the yield curve flattens to a near zero slope, and may invert. In recession, the yield curve rises sharply. This empirical regularity in the yield curve, combined with the notion that capital demand will have different responses to interest rates, implies a cyclical pattern to the composition of the capital stock.
It is possible to determine the nature of the pattern of response. In the multi-period model of the firm, the relevant concept is the discounted marginal revenue product of capital (Block, 1990):
(14)

Considering the term for any one time period, and its response to a change in the interest rate:
(15)

assuming positive values for t, r and MRPt. The derivative of this expression with respect to the time index is:
(16)

This sign of this expression will be negative for low values of t and r, and reverse to positive for larger values of t and r. For example, the expression is negative for t < 21 and r = 0.05 and positive for time periods beyond t = 21, negative for t < 11 and r = 0.10.
As t increases, for capital that is early in the production process, the interest rate effect on the discounted MRP becomes more negative. A decrease in the interest rate has a larger effect on the discounted MRP when t is large because the future MRPt are more heavily discounted. This implies a systematic response to a change in the interest rate: demand for capital for early stages of production is more sensitive to the interest rate change than is demand for capital for late stages of production. Hayek (1935, p.80) presented this in a graph which shows the effect of a decrease in the interest rate. Demands for capital all shift up, but the demands for capital in longer production processes shift more. In the recovery and expansion phase of a business cycle, when interest rates are lowered and the yield curve becomes steeper, demands for capital with longer production times increase more than demands for short period capital. In the late expansion and recession phase, when interest rates rise toward the natural rate and the yield curve flattens, demands for capital with longer production times will decrease more. The cumulative effect over the course of the cycle is to systematically alter the composition of the capital stock.
Mulligan (2002) has explored data on general resource use in response to changes in the interest rate. His results, summarized in his Table 3, are consistent with this analysis. The results are based on very consistent estimates of stable long-term relationships between labor employment and interest rates of different maturities. He estimates interest elasticities for resources employed by stage of a production process; “employment is countercyclical with output in predominantly late-stage-of-production sectors… [and] procyclical in predominantly early stage-of-production sectors” (Mulligan, 2002, p. 31). A regular pattern is that coefficients become smaller in absolute value as the maturity increases from 3 months to 1 year, then increase as the maturity increases to 3 year and 5 years. The pattern of greater response around a 1 year time period does not match what this paper’s model implies. Clark (1999) estimated a vector autoregression (VAR) model of the effect of a shock to the federal funds interest rate on prices of goods at different stages of production. He concluded that “at most early stages of production, an exogenous monetary tightening causes input prices to fall more rapidly and by a larger amount than output prices. The bulk of the evidence suggests that, at the finished stage of process, input prices move one for one with output prices following a monetary policy shock” (Clark, 1999, p. 430). His results are consistent with this paper’s model, that a tightening of monetary policy, which raises the short term interest rate, would reduce demands for capital, and by more for early stage capital.
If capital is easily convertible between types, the inefficiencies of the business cycle are reduced. A capital stock that becomes more concentrated in long term capital types could be adjusted at little or no cost in the late expansion phase when consumer demand shifts increases relative to investment demand. But if capital is inconvertible, or conversion is costly, then earlier mistakes in the accumulation of heterogeneous capital become constraints on producing consumer goods in the late expansion phase. Malinvestment reflects the overinvestment in capital for long production processes and the opportunity cost of consumer goods that cannot be supplied later. To model that process, we extend Scarth’s model and allow for a firm’s decision to convert long time process capital to short time process capital. The capital accumulation equations are revised to allow a firm to remove α percent of KL type capital in a given time period, which converts to KS type capital at some proportion c:
(4A)
(5A)
The first order condition for capital type KL is:
(7A)

The MRP for capital type KL depends on how KL may be productive in future time periods in the form of KL, relative to how productive it could be when converted to the form of KS. If c is large, then the cost of conversion from KL to KS is low, and if the marginal product of KS type capital is large, the firm will choose to convert KL to KS. Comparing the two models, with and without the conversion mechanism, we can evaluate equations (7) and (7A). The marginal revenue product of capital, without the possibility of conversion in equation (7), will be less than the marginal revenue product of capital, with the possibility of conversion in equation (7A), if:
(17)
That expression holds until α and c are each close in value to 1 (for example with c = 1 and α > 0.95); when it is nearly costless to convert KL capital to KS capital, and the firm has no restrictions on the proportion converted. Under more realistic conditions, with a considerable cost to conversion, the marginal revenue product of KL capital is greater given the possibility of conversion to KS capital.
In the expansion phase of the business cycle, rising consumer demand raises the value of the marginal product of KS. That also raises the interest rate toward the natural rate, which reduces the value of the marginal product of KL relative to that of KS. These changes contribute to firms choosing to convert excess KL to scarce KS.
We can establish an empirical regularity that interest rates are cyclical, especially in their term structure. Central banks use policy that reduces the short term interest rates in the recovery and expansion phase through a liquidity effect. The responses of demands for different types of capital depend on their marginal products and elasticities of substitution. In particular, the model implies that capital for long production processes is more affected by changes in interest rates than capital for short time processes. As the interest rate is lowered in the recovery and expansion, firms respond by increasing demand for capital in long production processes, altering the composition of the capital stock. As the expansion continues and interest rates rise with demand for consumer goods, demand for capital in short production processes rises and that may include conversion of other capital. The relative proportions of different capital types vary through the business cycle systematically in response to interest rate patterns.
Another implication of the model for investment is the persistence of investment decisions for production possibilities. Allowing for costly conversion of capital types also requires time, and projects the current period decision about the conversion rate α, into future production possibilities. A one-time shock to relative prices will have long-lasting real effects through the composition of the capital stock.
MEASURING THE CHANGE IN CAPITAL COMPOSITION
U.S. passenger airlines provide a specific example. The model considered two types of capital, for long and for short production processes, and this application to airlines will consider aircraft of different vintages and, more briefly, of different passenger capacities. The data (Jet Information Services, Section 3 Table 5, 2008) are the number of passenger jet aircraft owned at year-end by all U.S. airlines, annually for 1958-2008, for 83 specific aircraft types (such as an Airbus A320-200). Passenger jet aircraft account for about 83 percent of aircraft capital and about 65 percent of total assets among all the U.S. airlines. To account for differences in the size of aircraft, data were collected for the typical seat capacity of each aircraft type.6 A unit of capital is defined as one aircraft seat available for sale, and the capital stock or capacity is total available seats at the end of the year. This is a capacity measure rather than a measure of use—available seats that were produced as scheduled whether sold or not—since the airline operation occurs despite wide variations in the percentage of seats sold on a flight.
Capital stock for the airlines is heterogeneous. Only one major airline (Southwest) has operated with one type of aircraft. Airlines typically use several different aircraft types, often from different manufacturers, with variations by size (capacity in number of seats) and mileage range. An airline can serve its market share of the route with different size aircraft, depending on its choice of number of flights and flight times, given the choices of competitors. Planes are also complements within a route network and flight schedule, especially in the hub-and-spoke system used by most airlines since the 1980s. A key to profitability is achieving a good match between aircraft capacity, number of flights, flight times and market demand.
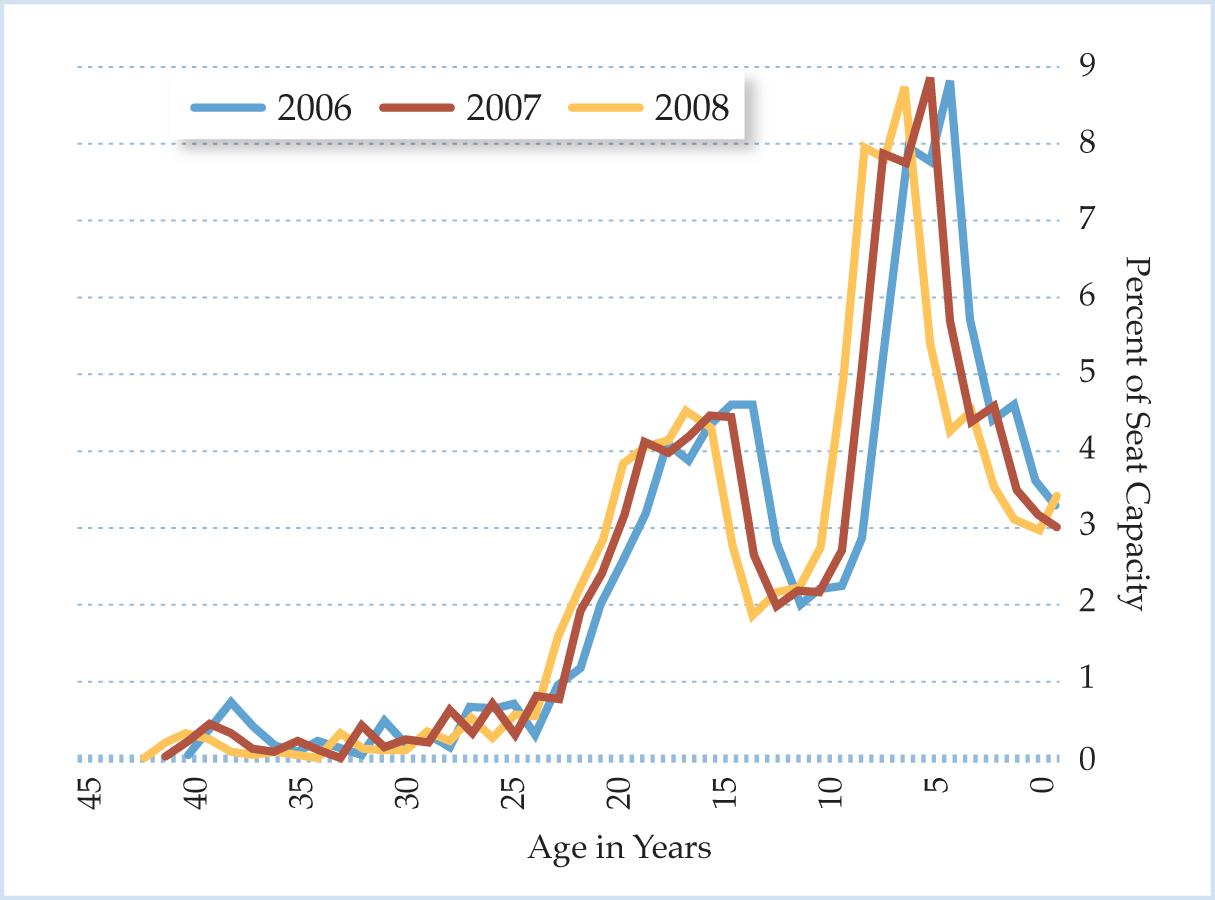
Capital stock has grown with a strong trend in demand for air travel. The industry fleet of jet aircraft has grown since the first was delivered in 1958 to 5781 aircraft in 2008. The age distribution of the aircraft capital stock has been relatively stable in recent years. Figure 2 shows the age distribution of aircraft seat capacity for the three most recent years. The chart shows that airlines in 2008 (at age 0) added 3.5 percent to seat capacity. Over all years, airlines have added between 2.5 and 9 percent of new seat capacity each year. Special events affect the acquisition of new aircraft and the retention of older aircraft. In the early 1990s, there was a sharp decline in growth of capacity that persisted from 1993-1997.7
Fig. 2. U.S. Airline Passenger Seat Capacity Age Distribution
The age distribution varies systematically over time. The distribution of capital by vintage is characterized in Figure 3 by measures for the 10th, 25th, 50th, 75th and 90th percentiles for capital age; the age for which 10 percent of the seat capacity of aircraft is that vintage or older, for example.8 Since the early years reflect rapid growth of the capital stock, we concentrate on the period 1980-2002, during which the patterns of the distribution are more stable. The age for the 10th percentile rises to about 25 years, and then stabilizes in a range of 21 to 25 years. The same trend is seen in the 25th percentile, which levels off at about 16-20 years. The 50th, 75th and 90th percentiles reflect firms’ decisions to add to existing capital in the current and recent years, and airlines’ tendency to eliminate aircraft in the 6-18 year age range. The 50th, 75th and 90th percentile age values have more stable mean over the sample than the 10th or 25th age percentiles, with the 50th at about 11 years, 75th at about 5 years and the 90th at about 2 years. Firms may add capital in a variety of ways. Airlines purchase new capital each year and also purchase or lease older vintage aircraft from sources outside the U.S. passenger aircraft fleet. They may retain existing capital stock longer than planned by additional maintenance or modernization of older aircraft.
Fig. 3. Percentiles of Aircraft Capacity Age

Detrended data show strong cyclical behavior. Percent deviations from trend percentile ages are shown in Figure 4 for the years 1980 through 2008.9 Clearly the 50th, 75th and 90th percentile ages are most responsive to change, as firms alter their new orders for new aircraft more than they change inventory of older aircraft.
Fig. 4. Detrended Aircraft Age Percentiles

As with some other industries, airlines are constrained by long “time-to-build” delays, and also have limited ability to alter an order for new capital: whether the order can be cancelled or when it will be received. Thus, the response of aircraft capital composition to macroeconomic recession years appears several years following the start of the recession. The ages for the 50th, 75th and 90th percentiles rises above trend through an economic recession, reflecting the decrease in new orders, cancellation or delay of previous orders and retention of older aircraft. Later in the economic expansions, the 50th, 75th and 90th percentile ages fall below trend as firms increased new orders for aircraft. The 10th and 25th percentile ages show less regular cyclical response. At the 75th and the 90th percentiles, age increases during recessions and decreases for expansions. Comparing the capital stock in successive years shows this pattern, and how much the structure of the stock can change. Figure 2 displays the age distribution in 2006-2007, at the peak of the U.S. business cycle, and in 2008, a year of recession. As the economy moved from expansion to recession, firms reduced purchases of new aircraft, and also retained older aircraft longer, especially very old (33 years and more) aircraft and middle vintage (10-17 years) aircraft. Previous business cycles in this sample exhibit the same pattern.
Table 1. Cross Correlations of Aircraft Age Percentiles with Cyclical Real GDP

Table 1 presents correlation coefficients between the aircraft age percentiles and detrended real GDP as a measure of cyclical macroeconomic activity.
The 10th percentile (the age for which 10 percent of the seat capacity is that age or older) and 25th percentiles, which represent older aircraft, show little cyclical behavior. The 75th and 90th percentile series have several significant correlations, and a mix of positive and negative correlations over time. If real GDP is above its trend, that decreases the 90th percentile age with lags of one to four years, and statistically significant correlations between -0.41 and -0.58. The effect carries over to the 75th percentile age with lags of three and four years, and for the 50th percentile age with a lag of four years. These correlations are consistent with firms purchasing new capital in lagged response to cyclical increases in real GDP. Real GDP above its trend is positively correlated with the 75th for leads of one to two years and for the 90th percentile ages with a lead of three years. For several years prior to increases in cyclical income, capacity needs are met by retaining older aircraft.
The capital stock also changes in composition by unit size of capital. We define four basic sizes of aircraft according to passenger seat capacity; Regional for 90 or fewer passengers, Small for 91-122, Medium for 123-209 and Large for 210 and more passengers. These occur with fairly well-defined breaks, and correspond to industry characterizations of planes. Isolating the small and medium size aircraft that have greatest possibility for substitution, a striking pattern is apparent. Firms expand capacity in one of these plane sizes to a much greater extent than the other, in alternating time periods. The composition of the capital stock changes systematically in terms of plane size over time. During recessions, there is a regular pattern of increased capacity in small aircraft and less addition of medium size aircraft. Other aircraft sizes show trends but do not show systematic cyclical patterns, so that the changes in composition of the capital stock are concentrated in particular types of aircraft rather than evenly diversified among all aircraft types or sizes.10
Capital creation is defined as addition to the capital stock from one year to the next. New aircraft and also older vintage aircraft are acquired, and firms may acquire capital from outside the U.S. commercial airline industry. Capital destruction is defined as the reduction of capital stock from one year to the next. After the initial year of purchase, aircraft may be sold outside the U.S. passenger aircraft fleet, converted to freight use, removed from the fleet for repair or long-term storage, or the aircraft may have been destroyed in an accident. In the 1990s, many “stage 2” aircraft that did not meet noise regulations were removed from service. For each year the types of aircraft that showed increases in numbers at each vintage were summed for capital creation flows, and those showing decreases were summed for capital destruction flows.
Fig. 5. Detrended Aircraft Age Percentiles

Figure 5 shows gross flows of capital creation and destruction annually for all airlines and all aircraft, expressed as positive percentages of total seat capacity. Davis, Haltiwanger and Schuh (1997, p. 18-20) characterized their measures of gross job flows for the aggregate economy as large, with average annual job creation at 9.1 percent and capital destruction at 10.3 percent in manufacturing for 1973-1988. While overall the capital stock for airlines grew at a compound rate of about 3 percent per year, capital creation ranges from 4-10 percent, and destruction usually ranges from 3 to 5 percent per year. The capital flows are smaller than Davis, Haltiwanger and Schuh’s job flows for the aggregate economy, as might be expected given the quasi-fixed nature of airline capital. However, they are still quite large, using their results as a reference point.
Following Davis, Haltiwanger and Schuh (1997), we define NET as the difference of creation and destruction, or the growth of the capital stock. SUM is the sum of the rates of capital creation and destruction, both measured in positive values. They suggest this conveys the “reallocation” of the resource or the degree of change from both sources. Table 2 presents summary measures for airline capital during 1980-2008.
Table 2. Capital Flows

Capital creation rates exceed capital destruction rates in all but 4 years in this period. Average creation flows are much larger than destruction flows, reflecting the growth of capital stock, and as shown in the mean of the NET variable. Creation flows are volatile, but destruction flows are relatively more volatile. This difference in volatility measures is consistent with business cycle patterns. The large values of creation flows occur during business cycle expansions. Relatively larger destruction flows occur during recessions, which are shorter in duration. The correlation coefficient between capital creation and capital destruction is –0.0007 for 1980-2008. Davis, Haltiwanger and Schuh (1997, p. 91-92) found negative correlations of job creation and destruction, at –0.36 for the U.S. economy for 1973-1988. NET and SUM are correlated at -0.1975 for 1980-2008. Davis, Haltiwanger and Schuh (1997) show negative correlations for the corresponding job flows.
Table 3 presents correlation coefficients between capital creation, destruction, and detrended real GDP as a measure of cyclical macroeconomic activity. These statistics show that capital creation and destruction are cyclical.
Table 3. Cross Correlations of Capital Flows with Cyclical Real GDP

Only a few correlations for the capital series are large and statistically significant. A change in real GDP above its trend is contemporaneously correlated with an increase in capital creation. A change in real GDP above its trend is correlated with an increase in capital destruction after lags of two and three years. The effects of a change in real GDP relative to trend begin concurrently and then persist for several years as airlines respond by changing the capital stock. They first add new capital and later increase rates of eliminating older capital.
When an airline acquires an aircraft, how long they own and operate the capital depends on the firm, and the type and vintage of aircraft, with great variation across firms and aircraft types. Davis, Haltiwanger and Schuh (1997) calculated the percent of jobs created that remained one and two years later. Specific aircraft are not tracked, but the total of an aircraft type owned by the firm is the measure of the capital stock (Air Transport Association, various issues). For the charts, all data are converted to an index where the maximum number of aircraft of the type owned by an airline is set equal to 100. Figure 6 shows persistence for a particular aircraft, the Boeing B-737, which is the single most popular aircraft. Several airlines (American, Continental and Delta) continue to add to their stock of this plane, while others (America West, United and US Airways) had reached their peak use in the 1990s and were decreasing their fleet. Across firms, there is variation in the level and persistence of use of even the most widely used aircraft type.
Fig. 6. Aircraft Persistence for B-737 Aircraft

Figure 7 shows persistence of selected aircraft types for a particular firm. The behavior of American Airlines for its major aircraft types for 1980-2008 is typical of other firms, regardless of size. These aircraft have similar years of initial use, but it is apparent that the capital types have different life lengths. Within a firm, these different types of capital have greatly different degrees of persistence.
The characteristics that are identified in this section support the concept of a heterogeneous capital stock for airlines. It has been possible to define types of capital components, either by vintage or by size of capacity, and possibly by other attributes. Airline firms treat aircraft types as distinct, and show varying rates of persistence in use. There are stable patterns over time, such as the age distribution of capital. Measures of the composition of the capital stock, by age or unit size, have well-defined cyclical behaviors.
Fig. 7. Capital Persistence for American Airlines

DISCUSSION AND CONCLUSIONS
Does the composition of capital stock change through the business cycle? Is the magnitude of the change enough to be a plausible explanation for cyclical changes in real GDP? This paper has attempted to provide a conceptual framework and measurements to evaluate those questions.
Following Mulligan’s notion of “heterogeneous and multiply specific” capital, we assume that capital cannot be measured by a scalar such as a monetary value or an index. We define several types of capital by vintage and by size of the capital unit. We offer a model of a firm’s investment over several periods in time. It considers more than one defined type of capital, with different marginal products and elasticities of substitution, and allows transfers between capital in the future. The model explains why the components of capital change in relative proportions, through changes in the cost of capital and differential effects on capital components’ marginal revenue product. The model implies that firms will consider the opportunity of using capital in other uses when they estimate expected productivity. We identify the conditions under which excess capital of one type will be converted to an alternative use. Exploring the demand functions for different types of capital goods, reveals why a change in the cost of capital can affect demands differently. In the model adapted from Scarth, equation (3), the longer time period affects the net present value of the capital through additional terms. We show in equation (16) that the discounted marginal revenue product with long production processes will be proportionally more influenced by a change in the cost of capital than capital with a shorter production process. Given a change in the cost of capital, investment flows for different types of capital are differentially affected, which systematically alters the composition of capital. As an application of the model, we chose the vintage and capacity of capital units as different capital types. Aircraft have a long expected life at about forty years given recent experience. Newly purchased aircraft have a long time period between application of the capital and the production of the service for final consumers. The hypotheses of the model suggest that a change in the cost of capital will affect the age distribution and the size distribution of airlines’ fleets.
The term structure of interest rates exhibits several empirical regularities. The slope of the yield curve is cyclical, falling across the business cycle expansion, often inverting, and becoming sharply steeper after a recession. Combined with this causal influence, the model implies that the composition of the capital stock will change systematically over the business cycle. McCulloch (1981) has illustrated how the vector of aggregate supply depends on the composition as well as the aggregate amount of capital.
Several characteristics of capital stock contribute to the cyclical nature of changes in production possibilities. Specialization in the design of capital, as with passenger aircraft, maximizes productivity for a range of applications, and reduces productivity in alternative uses. Time and cost of conversion make investments for a certain use long lasting, if not irreversible. When investment flows are disaggregated, there may be differential responses to investment incentives. “Time-to build” clearly varies across capital types, and the degree of response to changes in the cost of capital may also depend on capital characteristics such as durability or intensity. Cyclical changes in investment incentives alter the pace of capital accumulation. While a “capital overhang”, as some suggest existed for the U.S. economy following the 2001 recession, may not be apparent in the aggregate, it is more likely to occur in particular sectors or for particular capital types across sectors. The stock changes through several means, including depreciation, retirement of old capital, capital that is damaged or too expensive to repair, as well as the purchase of existing or new capital. All of these means may respond to the business cycle, especially as the cycle entails variation in capacity utilization rates.
The airline industry, with detailed data on types of capital, provides a case study for whether systematic patterns of change can be identified, and whether the changes are large. Airlines treat different aircraft as different types of capital. There is wide variation in how the airlines have used a particular aircraft (Figure 6) and how persistent is the adoption of an aircraft (Figure 7). We show there are regular, cyclical patterns of aircraft age distribution, especially in how airlines adjust capacity through acquisition and retention of aircraft of different vintages. Small and medium size aircraft display regular, alternating shares of capacity. Firms vary in their use of aircraft models, suggesting that they experience different aircraft as different capital components. Cyclical patterns emerge in the rate at which capital is acquired, increasing as expected during an economic expansion and decreasing during recession. The removal of old vintage capital by depreciation and the addition of new capital cause the age distribution to shift during the business cycle, and two cyclical responses are apparent. Firms retain older aircraft longer rather than retire earlier vintage equipment from use. Beyond about 20 years of age, the percent of capacity increases for later years in the expansion. Firms also add new capacity at a faster rate in the expansion, as shown in the percent of capacity for vintages less than about 10 years of age.
In the current economic expansion, airlines were adding to capacity with new vintage equipment at a relatively high rate of 6-8 percent per year, increasing over time. We characterize that rate as both cyclical and providing a substantial change in the age composition of the capital stock. Davis, Haltiwanger and Schuh characterized their similar measures of change as large by comparison to overall growth or decline of the labor force. Several measures of job flows supported their conclusion that the labor market was “fluid and flexible” with a great deal of job reallocation (1997, p. 19-20). They also found that “job destruction rises dramatically during recessions, whereas job creation changes relatively little” (1997, p. 84). While capital flow rates are smaller for the airline industry, creation and destruction show similar cyclical patterns and capital reallocation with much greater rates than overall capital growth. Airlines have typically added 6-9 percent to capacity in a given year with new capital. For the U.S. economy over all industries, private fixed investment since 1947 has been 6-8 percent of the net stock of private fixed assets in value terms (U.S. Department of Commerce, 2009).
These flows have often been considered small relative to existing capital for macroeconomic analysis in the short run. The assumption is that net investment in any one year cannot substantially affect the magnitude or composition of capital stock to alter aggregate productive capacity. If it takes a long time to affect capacity, then current period investment is not a large enough change in capital stock to account for changes in level or growth rates of real GDP in a business cycle. The implication is that changes in capital stock are long run or economic growth issues, rather than short run or business cycle issues. But if the cyclical changes in airline industry capital composition are pervasive in the economy, then heterogeneous capital may operate in a business cycle theory as a propagation mechanism. A crucial role is that changes in the relative capital factor supplies constrain the production possibilities enough to reduce real income in the recession phase of the cycle. The results of this paper suggest that there are substantial changes in the components of capital stock in one cyclical industry. Systematic variation in the structure of interest rates and differential responses of capital demands offer an additional explanation of business cycle movements in real income.
- 1James P. Keeler is Professor of Economics at Kenyon College (keeler@ kenyon.edu). J. Dean Craig is an ABD Ph.D. student at the Department of Economics at the University of Colorado at Boulder (joe.craig@colorado.edu).
- 2We thank William R. Melick and an anonymous referee for their helpful comments and suggestions.
- 3Mulligan (2002, 2006) provides excellent reviews of the Austrian business cycle theory.
- 4Hulten and Wycoff (1981), for example, found widely varying depreciation rates across asset classes.
- 5For a survey of the literature, see Wheelock and Wohar (2009).
- 6To account for differences in aircraft speed, data were collected on typical or maximum speed at cruising altitude, and capacity values were checked for that adjustment. Since the adjustment made little difference, it was not used for the data analysis. There was no adjustment for intensity of use of the aircraft measured in hours of use per day of aircraft. There are substantial variations in aircraft utilization rates. Davis, Haltiwanger, and Schuh (1997) analyzed data on employment and similarly were not able to “distinguish between full time and part time” jobs.
- 7Two forces created the decline. Firms purchased fewer new aircraft following the 1990-1991 recession, a time of greater excess capacity than airlines have previously experienced. Specifically, they bought fewer B737-500s, B757-200s, B767-300, MD11s and MD80s. More dramatically, airlines reduced their ownership of B727s. These aircraft were relatively fuel inefficient at a time when jet fuel prices increased rapidly, and they were “Stage 2” aircraft subject to Federal Aviation Administration regulations (also including early model B737s and DC9s). To reduce noise, especially at certain airports, the FAA designated certain aircraft as subject to “Stage 2” regulations which required airlines to either cease operating them or fit them with “hush kits” to reduce noise. In the early 1990s, airlines chose to reduce this form of capital in large numbers, and their resale prices fell rapidly.
- 8The aircraft age corresponding to the percentile was calculated from a smoothed function. A high-degree polynomial was estimated for the sample age distribution in each year individually. The estimated function is integrated and solved for each percentile in terms of years. These were compared to a kernel function estimate, which was quite similar.
- 9The data for age percentiles were detrended by several methods, including percent changes, an estimated linear trend, an estimated quadratic trend, a 3-year and 6-year moving average, and a Hodrick-Prescott filter. Data that were detrended with Moving Averages were quite muted compared to those with estimated trends. The quadratic and Hodrick-Prescott trends were very similar, and so only the data that were detrended with a quadratic trend are shown.
- 10During the 1980-82 and 1991 recessions, and the 1983-90 and 1992-2000 expansions, the capital creation rates for small and medium size aircraft moved in broadly opposite patterns, with a correlation of -0.50.

