

This week, the OECD released new life-expectancy figures for member countries.
The life expectancy at birth in the US is 79 years, according to the OECD’s 2015 edition of its Better Life Index. For the OECD overall, the life expectancy is 80 years. Here are all OECD states (plus non-OECD countries Russia and Brazil) compared:

These findings are quite similar to the World Health Organization’s own published life expectancy numbers. Worldwide, life expectancy at birth generally ranges from the low 60s (in African and Middle Eastern countries) to 83 or 84 years in Japan (depending on the measure). Only a smattering of African countries have a life expectancy below 60.
We can see that the US comes in at 79, which is slightly below Denmark at 80 years, and three or more years below Japan (83 years), Switzerland (83 years), Spain (83 years) and Italy (82 years).
What is the cause of the disparity between the US and so many European countries?
The media narrative on this, encouraged by the OECD report, was predictable:
Several factors account for the poor and declining life expectancy in the US, the report said, starting with its weak public health sector and the millions of Americans who remain uninsured.
Given that government spending on health care (as a percentage of GDP) in the United States is the fourth highest in the world, it’s not clear by what standard the sector is judged “weak.” Moreover, given that immigrants in the US have better health outcomes with less health insurance, it’s not at all clear that there’s a causal relationship there, either.
The report also blames “high income inequality,” although it’s unclear how the mere existence of a multi-billionaire in the marketplace in any way diminishes access to health care procedures for blue collar workers. In fact, it is often the extravagant cash spending of the billionaires that subsidizes new and experimental health care procedures that may become widely available over time.
But how does the US really compare to most other countries? And why is the US, while ahead of most of the world, toward the bottom end of the OECD figures?
The US Is Not Uniform
As with so many other measures of human activity, such as murder rates and median incomes, it makes little sense to compare the US as a whole, with its 315 million ethnically diverse people, to a country like Finland which has a homogeneous population of five million people.
Comparing individual states to foreign countries is often difficult, but life expectancy measures are more straightforward than many others. According to the Social Science Research Council’s Measure of America report, life expectancy nationwide in the US is also 79, but if we begin to look at individual states, we quickly see there can be some big differences from place to place:

In the US, life expectancy ranges from 75 in Mississippi to 81 in Hawaii. If Hawaii were measured as an independent country, it would have one of the world’s highest life expectancy numbers. In fact, if we include individual US states in our analysis of OECD life expectancy numbers, we get a different view:
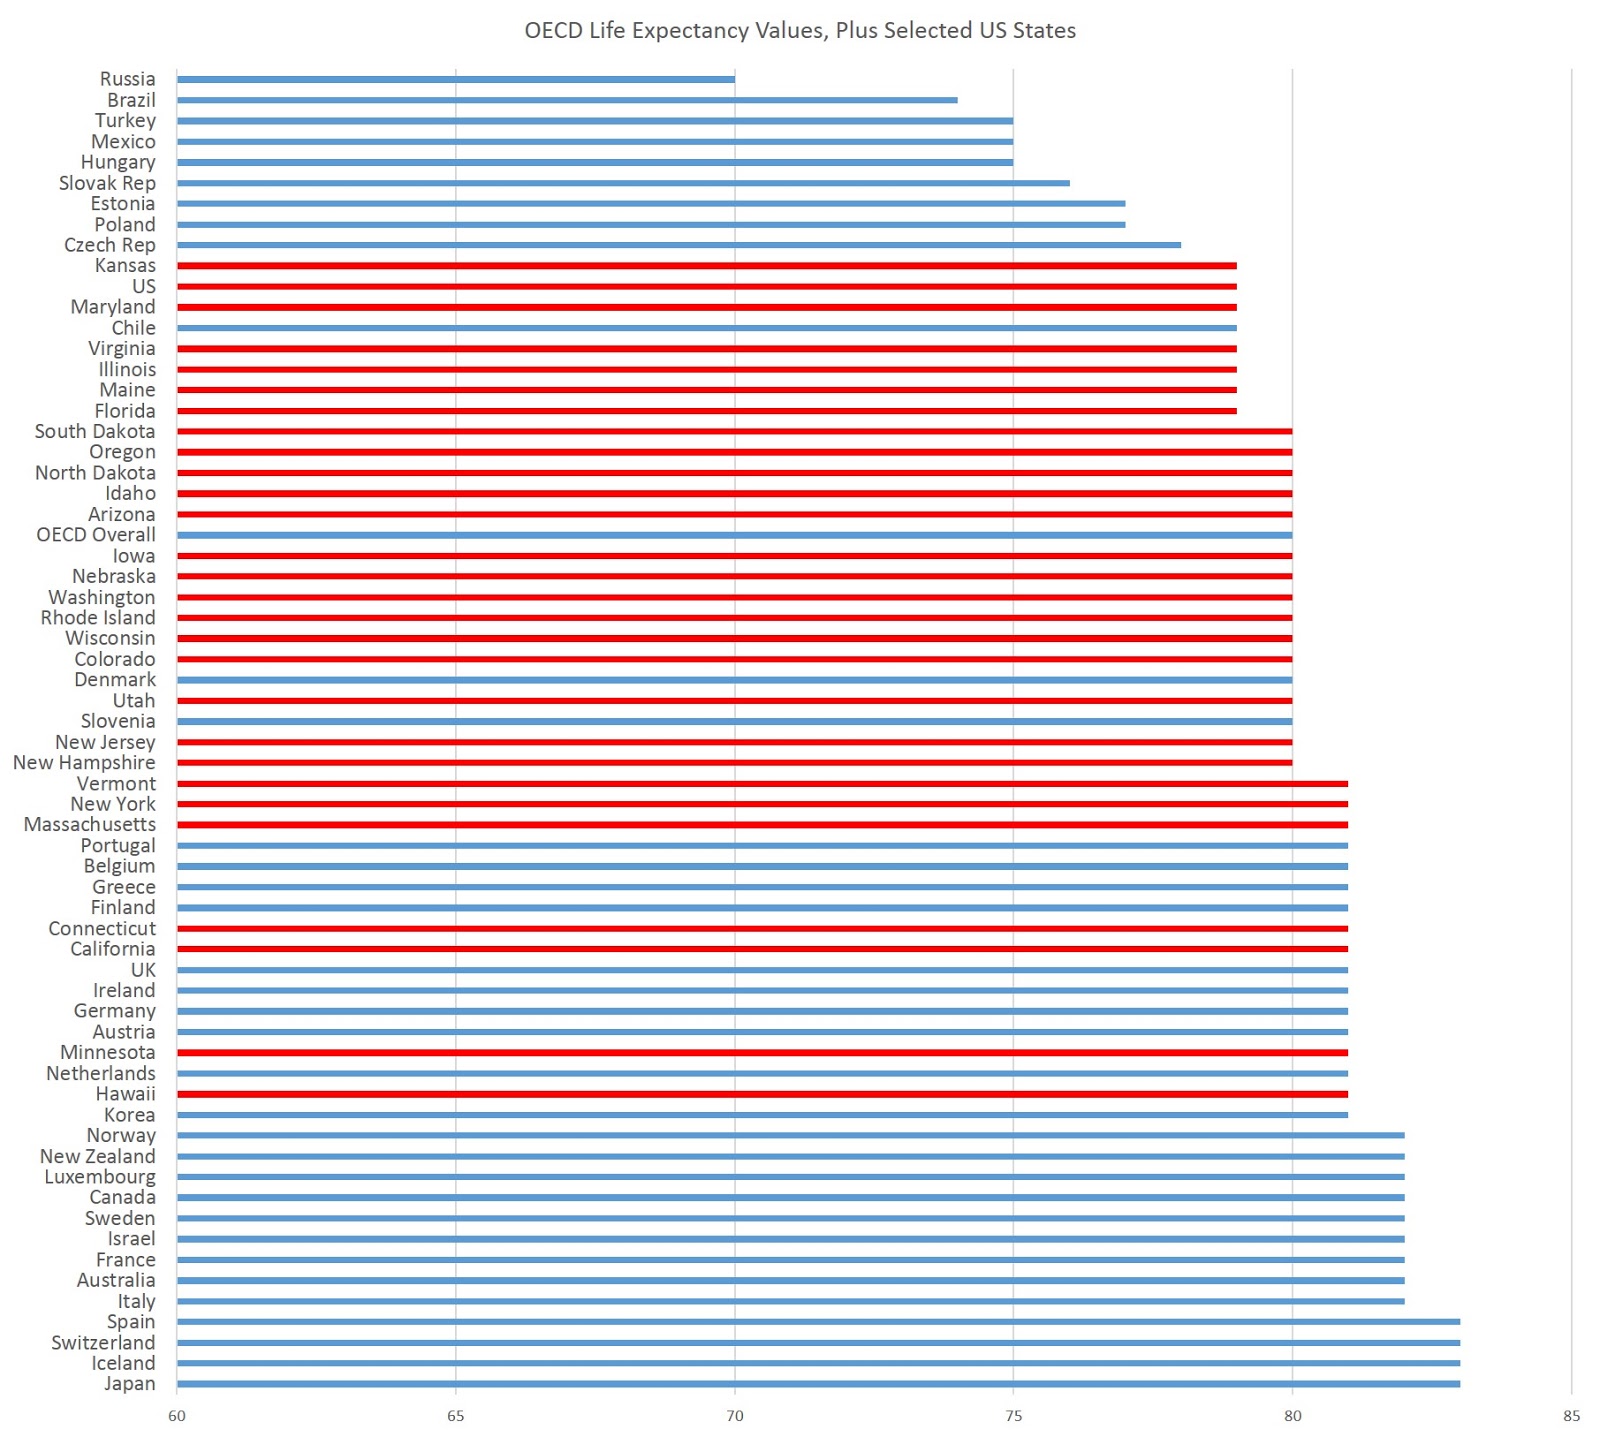
In this case, I’ve added in all the US states that have a life expectancy equal to or greater than the US-wide number of 79 years. All the states I didn’t include, ranging from 75 years to 78 years, are roughly equal in life expectancy to Poland, Hungary, and the Czech Republic (all of which have tax-funded universal health care, by the way).
But once we examine the data this way, we might ask ourselves why Denmark has a life expectancy equal to or lower than 16 US states.
For someone to whom life expectancy is really important, he or she could be equally well off in Minnesota as in the Netherlands, Austria, Germany, Ireland, the UK, Finland, Belgium, Greece, and Portugal. By this measure, it’s even better in Minnesota (and in Hawaii, California, Connecticut, Massachusetts, New York, and Vermont) than in Denmark and Slovenia.
And unlike Luxembourg or Iceland, which are essentially city states with populations of a half-million or less, Minnesota (to name just one example among US states) is quite comparable to independent OECD countries since it has a population similar to Norway, Denmark, and Finland. California, which has a life expectancy of 81, would be one of the largest member OECD countries, were it to join on its own.
Plus, if taken together, the 16 states that rank equal to or better than Denmark contain over 100 million people in all, or about a third of the US population.
What we quickly find, then, is that the allegedly “American” issue of lower life expectancy is really just a regional issue that applies to the American South and a handful of Midwestern states.
Moreover, variation in overall health policy, while it does vary somewhat from state to state, certainly varies less from California to Kansas than it varies between Italy and Denmark. Individual states in the US can add on to national health care policies here and there, but all states are dominated budgetarily and legally by national programs such as Medicare and Medicaid. So, if the overall legal environment for healthcare varies only slightly from state to state, we clearly need to look somewhere other than the “public health sector” to account for the differences in life expectancy.
(To see how individual Canadian provinces fare, see here. The northern rural provinces and territories of Canada would rank in the middle of US states, as would Manitoba and Saskatchewan.)
The Role of Ethnicity
Just as we can find sizable variations by region and state in the US, we can also find significant differences in life expectancy according to racial and ethnic background.
In the US, where life expectancy is 79 overall, (non-Hispanic) whites have a life expectancy of 79. But the life expectancy for Asian-Americans is 87, while its 83 for Latinos. Life expectancy is 75 for African-Americans.
And, of course, this varies by state.
Life expectancy for Asian-Americans in California, for example, is 86 years. It’s 87 years in Colorado. According to the OECD, the life expectancy in Japan, where 98% of the population is ethnically Japanese, is 83. Similarly, the life expectancy in Korea (which is also ethnically homogeneous) is 81. Life expectancy levels in all other Asian countries are lower (except for Singapore and Hong Kong at 84). In other words, if one is measuring well-being in terms of life expectancy, it’s very likely that ethnic Asians are better off living in California, Colorado, and about a dozen other US states, than they are living anywhere in Asia.
Latinos fare better than non-Hispanic whites as well. In California, for example, the life expectancy for Latinos in the US is 83. It’s 83 in Florida, 88 in Virginia, and 81 in Texas.
It should not surprise us then, that the life expectancy in states with large numbers of Asian-Americans (Hawaii, for example) have higher life expectancy than many OECD countries. California, of course, has sizable populations of both Latinos and Asian-Americans.
Some — but not all — of this, is due to the fact that the Asian-American and Latino populations have a higher-than-usual number of immigrants among them. And I discussed here, immigrants are generally healthier than the US population as a whole. (For a brief discussion on the so-called Hispanic Paradox, see here.)
Obesity Is a Major Issue
When looking at mortality in the US, where heart disease, strokes, and diabetes are, by far, more deadly than the homicides or car accidents, obesity is likely a major factor in life expectancy.
We know, for example, that the US (taken as a whole) is the most obese country in the OECD (with Mexico close behind):
According to the OECD’s Obesity Update:

If we examine European countries by obesity rate, we do not find much of a correlation at all. It seems there are just too many variables, ranging from large variations in disposable income to diet to ethnicity.
Within the US, interestingly, there’s an obvious connection between obesity rates and life expectancy:

Clearly, those states that have low obesity rates also tend to have higher life expectancy.
An astute observer might look at this and conclude that the problem can be solved by increasing incomes in the more obese states, as someone familiar with relative median incomes among the states might notice that the more obese states tend to be the poorer states.
But, as I’ve noted here, the higher obesity rates in the poorer states is more likely related to a lack of foreign born residents, including those higher-life-expectancy groups of Asian-Americans and Latinos. Improving diet and obesity is not simply a matter of raising incomes. Moreover, the experience in Eastern Europe, where life expectancies are low — but where universal tax-funded health care services are nearly universal — illustrate that there’s a lot more going on in high levels of life expectancy than government spending.
We see this in the Latino data, since Latinos have lower median incomes, but higher life expectancy than non-Hispanic whites:

So why is life expectancy in the US lower than most OECD countries? It’s difficult to say, but if there’s anything we can learn by looking more closely at the data, it’s that simply saying “it’s gun violence” or “its too many cars” or “it’s a weak public health sector” is simplistic in the extreme.

