

How many times have you heard that higher taxes mean greater social welfare and economic development? The statement is backed up by a touch of popular wisdom: “More taxes, more public services.” Almost incontestable empirical evidence is also cited: with very few exceptions, the richest countries’ tax rates are very high, whereas taxes in poor countries are relatively low.
This article analyzes the statistical relationships that suggest that high tax burdens (government revenue/GDP) are linked to a high level of development (measured by GDP per capita).
We will see that the positive relationship between GDP per capita and tax burden suffers from a statistical problem known as Simpson’s paradox.
Simpson’s Paradox
The paradox got its name from the British statistician Edward Simpson. It refers to an error that results from analyzing aggregate data when, really, the observations belong in separate categories. Data disaggregated by category show one trend, whereas aggregate data show a different one.
Imagine we want to compare the number of bedrooms in a house with its price. We would expect the price of the home to increase as the number of bedrooms increases. However, if we look at all the data together, we see a marked negative trend. In other words, the more bedrooms a home has, the lower its price. Nonetheless, when we analyze the data by groups, we see that our first instinct was correct: the more bedrooms a home has, the higher its price.
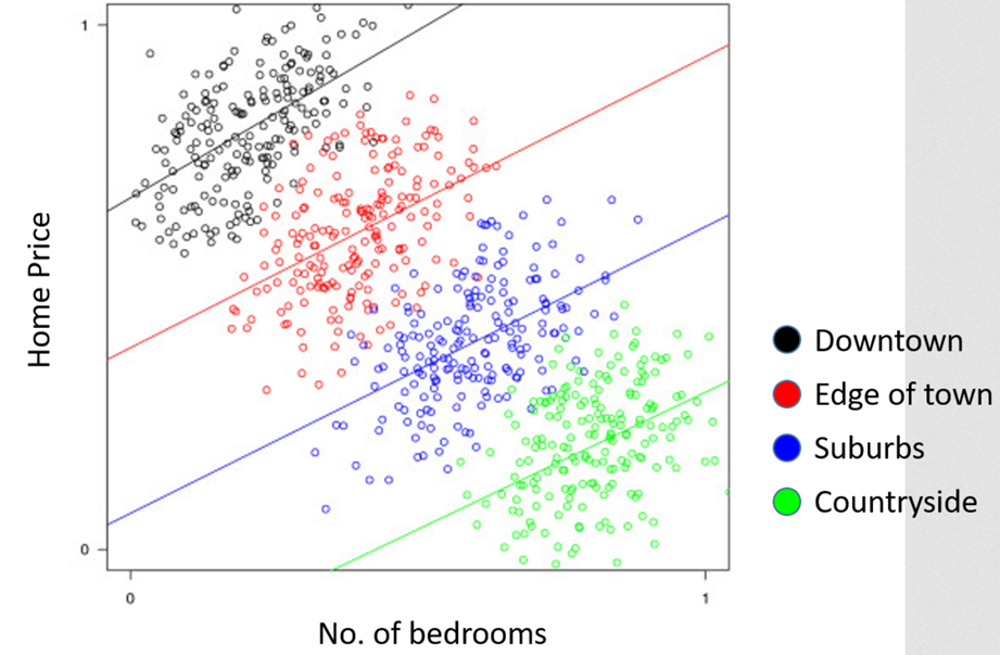
Source: Borgatti (2017)
What is the problem? We are comparing apples and oranges. The number of bedrooms in a home (or the floor area) is not the only factor that affects its price. When determining the price of a home, its location is at least as important as its number of bedrooms.
The graph above shows homes grouped by area. Each point represents an apartment, and each color represents a different zone in a city (black represents downtown; red, the edges of town; blue, the suburbs; and green, the countryside). Homes are more expensive the closer they are to the city center. Once we take into account how near or far the home is from the city center, the number of bedrooms is indeed positively related to the price of the home.
Simpson’s paradox and this example demonstrate that one needs to be careful when interpreting statistical data.
As we will see, the apparent relationship between tax burden and economic growth suffers from a similar interpretation problem.
Analyzing Aggregate Data of the Tax Burden and per Capita Income: First Estimate
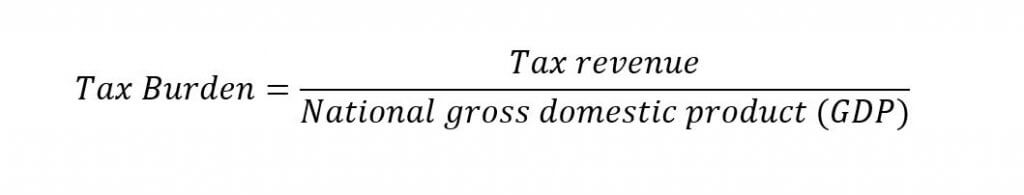
First, we must analyze the aggregate data of the tax burden and per capita income. Keep in mind that tax burdens are equal to tax revenue divided by total economic output.
With data from 2018, we can see that unquestionably, countries with higher taxes have higher income per capita.
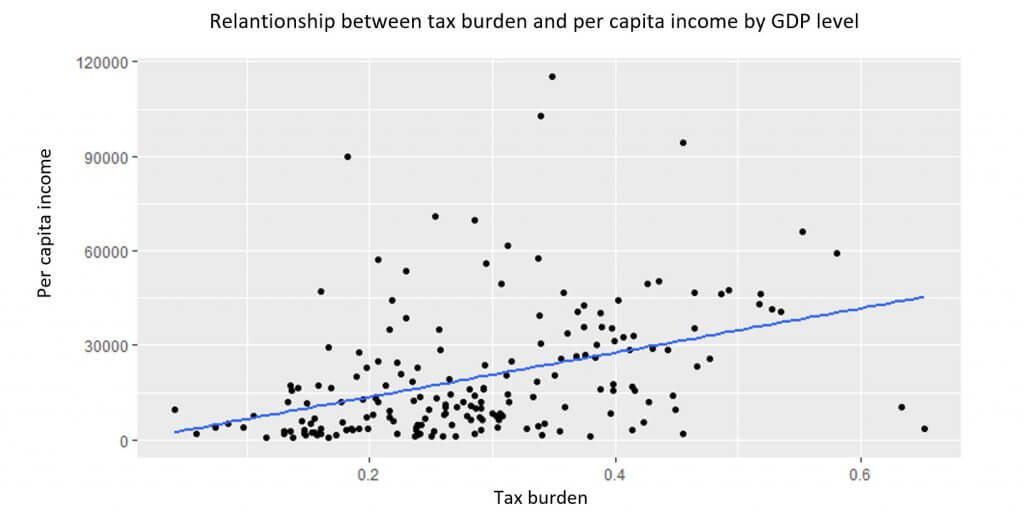
Source: Prepared by the author with data from the International Monetary Fund (IMF). $2011 in PPP
For approximately every percentage point by which the tax burden increases, per capita income increases by no less than $700 per year.1
That is the conventional analysis. It is the one most used by economists and analysts who defend the idea that it is necessary to raise taxes in order to spur economic growth.
It would seem that the solution to economic stagnation is very clear: if the richest countries have a higher tax burden, then it is necessary to increase a country’s tax burden in order to improve its welfare.
Now let’s analyze the data disaggregated by the level of development to see if this conclusion still holds.
Analyzing disaggregated data: the real relationship
To disaggregate the data, we use the World Bank’s classification of every country by level of income:
- Low-income countries (Gross national income (GNI) per capita of less than $1,025 per year; 30 countries)
- Medium-low-income countries (GNI per capita of $1,026 to $3,995 per year; 46 countries)
- Medium-high-income countries (GNI per capita of $3,996 to $12,375 per year; 58 countries)
- High-income countries (GNI per capita greater than $12,376 per year; 60 countries)
We analyze the relationship between tax burdens and per capita income separately for each group of countries.
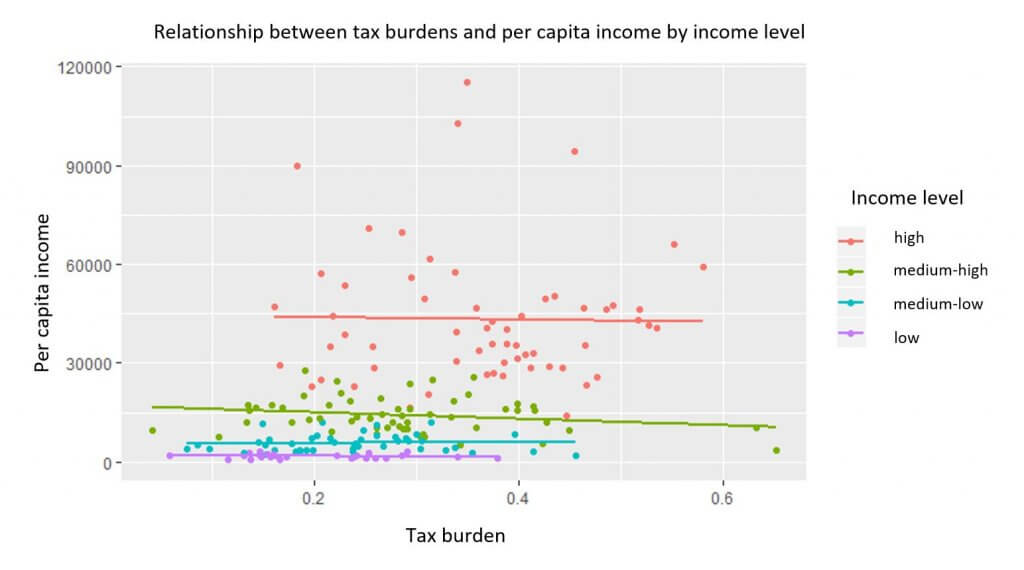
Source: Prepared by the author with data from the IMF. $2011 in PPP
The red points represent high-income countries; the green points are countries with medium-high incomes; the blue, medium-low incomes; and the purple, low incomes. Their respective lines show the trends.
As we can see, the positive relationship that we see with aggregated data disappears for all income levels. In other words, a greater tax burden does not accompany a higher level of income once each country’s level of development is taken into account.
Below, the same calculation is done, but using per capita–income logarithms to better understand the previous graph’s relationships.2
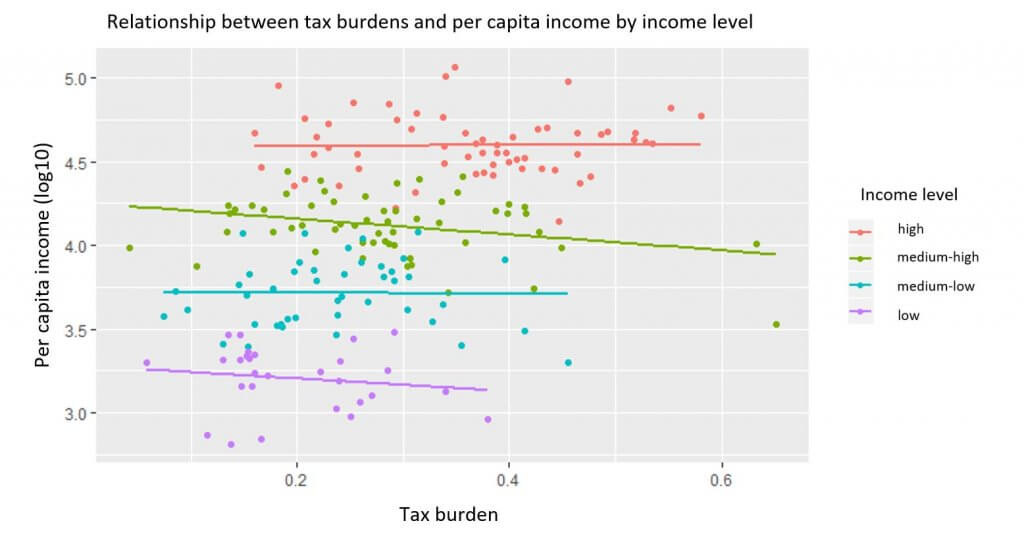
Source: Prepared by the author with data from the IMF. $2011 in PPP
This demonstrates even more clearly that the relationship between tax burdens and per capita income is practically nonexistent. What’s more, the relationship is negative in some cases, although it is statistically insignificant.3
If a country decides to increase its tax burden, it will not make its citizens more prosperous.4
Conclusion
Empirical analysis that seeks to prove that raising taxes leads to greater economic development falls prey to Simpson’s paradox. Statistics, when used correctly, indicate that raising taxes does not improve economic growth.
The statistical relationship is clear. The idea of increasing taxes to become a rich country is simply magical. The richest countries are not rich because they have large governments. The relationship seems to be that the countries are rich first, and only after that can they permit themselves the luxury of having large governments.
The “traditional view in economics” is right. Increases in per capita income and reductions in poverty levels appear only when productivity increases. Increases in productivity go hand in hand with more capital being invested well. To ensure that capital is properly invested, governments must not put obstacles in place for—or provide aid to—private initiatives, whether they are domestic or foreign.5
Reprinted from UFM Market Trends. For appendices, please see the original article.
- 1See first regression in the appendix for statistical significance.
- 2Using logarithms allows an economist to solve statistical problems that appear in variables such as income.
- 3See regression 2 in the appendix.
- 4However, it is very likely that a politician or bureaucrat who handles taxes does receive a higher income at the expense of making the taxpayer poorer.
- 5In the last resort, for a government to act this way, a population must accept the social principles upon which market cooperation is based. This is Deirdre McCloskey’s hypothesis.
