The Inflation Crisis, and How to Resolve It
2. Our Forty-Year Record
2
Our Forty-Year Record
A casual reader of the newspapers and of our weekly periodicals might be excused for getting the impression that our American inflation is something that suddenly broke out in the last two or three years. Indeed, most of the editors of these periodicals seem themselves to have that impression. When told that our inflation has been going on for some forty years, their response is usually one of incredulity.
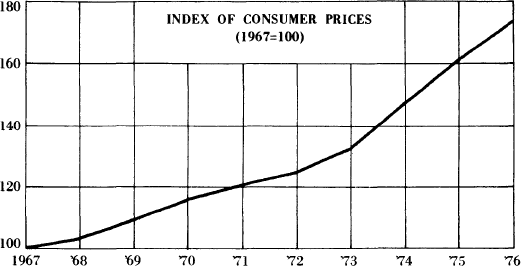
A large number of them do recognize that our inflation is at least nine or ten years old. They could hardly help doing so, because the official figures issued each month of wholesale and consumer prices are stated as a percentage of prices in 1967. Thus the consumer price index for June 1976 was 170.1, 0.5 percent higher than in the preceding month and 5.9 percent higher than in June of the year before. This means that consumer prices were over 70 percent higher than in 1967, a shocking increase for a nine-year period. The annual increases in consumer prices ranged from 3.38 percent between 1971 and 1972 to more than 11 percent between 1973 and 1974. The overall tendency for the period was for an accelerating rate. The purchasing power of the dollar at the end of the period was equivalent to only about fifty-seven cents compared with just nine years before.
But the inflation may be dated from as early as 1933. It was in March of that year that the United States went off the gold standard. And it was in January 1934 that the new irredeemable dollar was devalued to 59.06 percent of the weight in gold into which it had previously been convertible. By 1934, the average of wholesale prices had increased 14 percent over 1933; and by 1937, 31 percent.
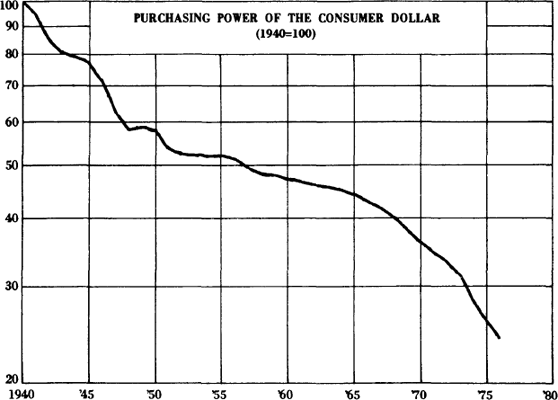
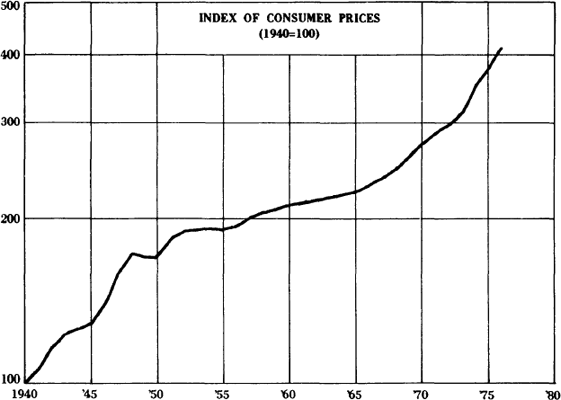
But consumer prices in 1933 were almost 25 percent below those of 1929. Nearly everybody at the time wanted to see them restored toward that level. So it may be regarded as unfair to begin our inflationary count with that year. Yet even when we turn to a table beginning in 1940, we find that consumer prices as of 1976 were 314 percent higher than then, and that the 1976 dollar had a purchasing power of only twenty-four cents compared with the 1940 dollar.
These results are presented herewith for each year in two tables and three charts. I am indebted to the American Institute for Economic Research at Great Barrington, Massachusetts, for compiling the tables and drawing the charts at my request.
The figures tell their own story, but there are one or two details that deserve special notice. In the thirty-six-year period the nation’s money stock has increased about thirteen times, yet consumer prices have increased only a little more than four times. Even in the last nine of those years the money stock increased 119 percent and consumer prices only 74 percent. This is not what the crude quantity theory of money would have predicted, but there are three broad explanations.
First, measuring the increase in the stock of money and credit is to some extent an arbitrary procedure. Some monetary economists prefer to measure it in terms of what is called M1. This is the amount of currency outside the banks plus demand deposits of commercial banks. The accompanying tables measure the money stock in terms of M2, which is the amount of currency outside the banks plus both the demand and time deposits of commercial banks. M1, in other words, measures merely the more active media of purchase, while M2 includes some of the less active. I have used it because most individuals and corporations who hold time deposits tend to think of them as ready cash when they are considering what purchases they can afford to make in the immediate or near future. But in recent years time deposits have grown at a much faster rate than demand deposits. So if one uses M2 as one’s measuring stick, one gets a much faster rate of increase in the monetary stock than by using M1. (The latter has increased only eight times since 1940.)
Second, one very important reason why prices have not gone up as fast as the monetary stock is that both overall production and production per capita have risen steadily almost year by year. With the constant increase in capital investment—in the number, quality, and efficiency of machines—both overall productivity and productivity per worker have risen, which means that real costs of production have gone down.
The third explanation has to do with subjective reactions to increases in the money stock. Statistical comparisons in numerous countries and inflations have shown that, when an inflation is in its early stages or has been comparatively mild, prices tend not to rise as fast as the money stock is increased. The fundamental reason is that most people regard the inflation as an accidental or unplanned occurrence not likely to be continued or repeated. When an inflation is continued or accelerated, however, this opinion can change, and change suddenly and dramatically. The result is that prices start to rise much faster than the stock of money is increased.
| Year | Money Stock (M2) |
Consumer Price Index |
Purchasing Power of the Consumer Dollar |
| 1967 | 100.0 | 100.0 | 100.0 |
| 1968 | 108.9 | 104.2 | 96.0 |
| 1969 | 116.2 | 109.8 | 91.1 |
| 1970 | 121.0 | 116.3 | 86.0 |
| 1971 | 135.0 | 121.2 | 82.5 |
| 1972 | 149.3 | 125.3 | 79.8 |
| 1973 | 163.6 | 133.1 | 75.1 |
| 1974 | 177.4 | 147.7 | 67.6 |
| 1975 | 191.0 | 161.2 | 62.0 |
| 1976 | 218.71 | 173.92 | 57.53 |
| 1940 | 100.0 | 100.0 | 100.0 |
| 1941 | 113.2 | 105.1 | 95.1 |
| 1942 | 128.9 | 116.4 | 85.9 |
| 1943 | 162.9 | 123.6 | 80.9 |
| 1944 | 193.5 | 125.6 | 79.6 |
| 1945 | 229.4 | 128.5 | 77.8 |
| 1946 | 251.3 | 139.3 | 71.7 |
| 1947 | 264.5 | 159.4 | 62.7 |
| 1948 | 268.3 | 171.7 | 58.2 |
| 1949 | 267.2 | 170.1 | 58.8 |
| 1950 | 273.2 | 171.7 | 58.2 |
| 1951 | 283.3 | 185.5 | 53.9 |
| 1952 | 298.7 | 189.5 | 52.7 |
| 1953 | 310.1 | 191.0 | 52.4 |
| 1954 | 321.0 | 191.8 | 52.1 |
| 1955 | 332.8 | 191.2 | 52.3 |
| 1956 | 338.6 | 194.1 | 51.5 |
| 1957 | 347.5 | 200.8 | 49.8 |
| 1958 | 364.3 | 206.4 | 48.5 |
| 1959 | 381.3 | 207.6 | 48.2 |
| 1960 | 385.1 | 211.3 | 47.3 |
| 1961 | 405.3 | 213.5 | 46.8 |
| 1962 | 428.7 | 216.0 | 46.3 |
| 1963 | 456.4 | 218.6 | 45.7 |
| 1964 | 485.0 | 221.5 | 45.1 |
| 1965 | 523.9 | 225.2 | 44.4 |
| 1966 | 564.6 | 231.8 | 43.1 |
| 1967 | 607.9 | 238.3 | 42.0 |
| 1968 | 662.2 | 248.4 | 40.3 |
| 1969 | 706.3 | 261.7 | 38.2 |
| 1970 | 735.4 | 277.3 | 36.1 |
| 1971 | 820.8 | 288.9 | 34.6 |
| 1972 | 907.4 | 298.6 | 33.5 |
| 1973 | 994.8 | 317.2 | 31.6 |
| 1974 | 1,078.5 | 352.5 | 28.4 |
| 1975 | 1,160.9 | 384.2 | 26.0 |
| 1976 | 1,329.24 | 414.35 | 24.16 |
7 Estimated from data through June.
The great danger today is that what has been happening since 1939—to prices as compared with the rate of money issue—may have given a false sense of security to our official monetary managers as well as to most commentators in the press. The enormous increase in the American money stock over the past thirty-five to forty years must be regarded as a potential time bomb. It is too late for continued complacency.