Economics and The Public Welfare
67: The Causes of the Crisis of 1937
Chapter 67
The Causes of the Crisis of 1937
What caused the major crisis of 1937? Why did the stock market yield so suddenly and so violently? And why did the volume of business and industrial production decline so rapidly?
The Erroneous Explanation Based on Money Market and Federal Finance. One explanation has been offered from the standpoint of those who believe that artificially cheap money and expanding bank credit and government deficit spending are needed to make prosperity, a view which is wholly invalid. This view blames the crisis on three factors. (1) The Federal Reserve authorities doubled the reserve requirements of the member banks in 1936 and 1937 by stages, beginning in 1936 and ending in early 1937, as we have seen in a preceding chapter. This reduced excess reserves from around 3 billion dollars to $927,000,000 as the average for May, 1937. (2) The Secretary of the Treasury, in the winter of 1936-1937, adopted the policy of “sterilizing” the incoming gold, so far as effect on our money market was concerned, by not issuing new gold certificates against it, but instead by borrowing money from the commercial banks with which to buy it, so that for a time incoming gold ceased to add to member bank reserves. (3) It was alleged that the Government’s deficit was radically reduced, and that it disappeared when social security taxes and disbursements were taken into account. The theory was that Government “investment” (i.e., Government deficit spending), which, it was assumed, was needed to offset deficiencies in private investment, failed to do its duty, with an inevitable crash in the business structure.
It is easy to demonstrate that this view is a mare’s nest. The financial phenomena of the period, taken altogether, were definitely favorable to increasing business activity.
Increased Reserve Requirements Accompanied by Great Increase in Commercial Loans. First, it may be observed with respect to the volume of excess reserves that reducing the excess reserves could not reduce the volume of business unless real differences were made thereby in interest rates, and unless restrictions were imposed thereby upon the use of money and credit. Now the evidence is overwhelming that nothing of this sort occurred. The rate on open market commercial paper, four to six months, moved up from 3/4% to 1%. Rates on customers’ loans by banks continued to sag. The average in 19 cities stood at 2.70% in July of 1936 and sagged to 2.55% in August1 of 1937. The rate on Treasury bills moved up from a little over 1/10% in December, 1936, to 3/10% in April, 1937, dropping again to less than 3/10% in July and August of 1937. All these rates remained absurdly low. The call rate on stock exchange loans remained unchanged, pegged at 1%. The yield on long term United States Government bonds moved up from 2.65% in July, 1936 to 2.80% in April, 1937, dropping again to 2.72% in August, 1937. The yield on tax-exempt Treasury notes, three to five years, moved up from a 1936 average of 1.11% to a 1937 average of 1.40%. Absolutely no restriction was placed on any transaction by interest changes of this kind.
On the contrary, coincident with the increase in the reserve requirements two highly encouraging developments in banking and in investment banking took place.
(1) Commercial loans of the banks increased dramatically, beginning in the third quarter of 1935 and moving through 1937. The increase in this period was over 2 billion dollars for the member banks of the Federal Reserve System alone—from $4,834,300,000 on June 29, 1935 to $6,996,000,000 on December 31, 1937—a striking commentary upon the theory which Lauchlin Currie had advanced in his book, The Supply and Control of Money in the United States, in 1934, that commercial loans in American banking “belong to a past era.” 2
(2) Coincident with the increase in reserve requirements of the member banks was a great increase in new issues of securities. The issue of new securities had been at an appallingly low level through the years 1932, 1933, 1934, and 1935, and the first quarter of 1936, the average volume for this period being well below 15% of the volume of new securities issued in the year 1923. The first quarter of 1936 showed new securities at 15.8% of the first quarter of 1923. This figure began to rise in the second quarter of 1936 and moved steadily through the second quarter of 1937 to a level of approximately 50% of the new securities issued in 1923. New security issues in strong volume continued in 1937 until the stock market crash.
Bank Deposits and Brokers’ Loans Rise. We have seen in the preceding chapter how little effect upon money rates excess reserves had after the first billion. The foregoing figures for the rapid growth of commercial loans and the rapid growth of new security issues are enough to prove that increases of fractions of 1% in interest rates, from levels absurdly low to levels still absurdly low, made no difference at all in the willingness of the markets to use money, so long as they had any confidence that its use would bring a return.
It is true that there was a decline in member bank holdings of Government securities in this period, amounting to $900,000,000 between June 30, 1936, and June 30, 1937. But this is a wholesome and natural phenomenon in a time of reviving business, and a recurrent phenomenon in times of reviving business. And the decline of less than a billion in Government securities in the assets of member banks was very much more than offset by the rise of 2 billion dollars in commercial loans in its effect on aggregate bank credit. The deposits of these banks rose nearly $800,000,000 between June, 1936 and June, 1937.
There was, further, a rise in 1936 and 1937 in the volume of money borrowed by brokers from banks and in the volume of money lent by broken to customers. Money borrowed by brokers from banks increased from approximately 800 million dollars in early 1936 to approximately 1250 millions at the peak of 1937, while brokers’ credit to customers increased in the same period from about 1200 million dollars to nearly 1600 million dollars between the low of 1936 and the high of 1937.3
Government Deficit Continues. The third proposition, that the Government’s deficit, taking into account the Social Security taxes, virtually disappeared, and that this was the cause of the business crisis, simply will not stand a careful examination of the figures, taken month by month. The table on page 442 shows the Government’s expenditures, revenues (including customs and social security taxes) and deficits (or surpluses) month by month for the whole of 1937 and the first quarter of 1938.
It will be observed that there are occasional small surpluses coming at a time when great surpluses ought always to come, in the tax months March, June, September, and December. In 1937 there was no such surplus in June, but rather a deficit of $427,000,000. June expenditures, however, included $500,000,000 of bonds placed into the United States Government Life Insurance Fund, under the soldiers’ bonus legislation of 1936, so that there was an actual “cash surplus” for June, of $73,000,000—a trifling surplus for an income tax month.4 The surplus even in September of 1937 was small, only 114 millions. Government deficit financing was doing its full duty (if it has a duty) in 1937, and it was in the ninth month of 1937 that the disastrous business crash began.
| Summary of Treasury Receipts and Expenditures* (000,000 omitted) | ||||
|---|---|---|---|---|
| Revenues | Expenditures | Deficit | ||
| Social security taxes | Total receipts | (Excl. debt retirement) | ||
| 1937 | ||||
| January | 3 | 284 | 539 | 300 |
| February | 10 | 275 | 547 | 317 |
| March | 50 | 1,012 | 766 | 201 Surplus |
| April | 78 | 363 | 695 | 377 |
| May | 59 | 335 | 514 | 224 |
| June | 53 | 868 | 1,254 | 427 |
| July | 53 | 409 | 638 | 271 |
| August | 60 | 453 | 517 | 104 |
| September | 50 | 788 | 633 | 114 Surplus |
| October | 52 | 333 | 565 | 273 |
| November | 60 | 327 | 453 | 167 |
| December | 138 | 866 | 635 | 188 Surplus |
| 1938 | ||||
| January | 57 | 335 | 492 | 198 |
| February | 110 | 349 | 474 | 166 |
| March | 3 | 959 | 705 | 211 Surplus |
| April | 34 | 273 | 631 | 369 |
* Banking and Monetary Statistics, Board of Governors of Federal Reserve System, 194.3, p. 514.
Even on “Cash Income and Outgo” Basis. A refinement of this theory has developed since the Treasury began, in 1939, to give us figures for the “cash income” and “cash outgo” of the Treasury. These figures are different from the budgetary figures of receipts, expenditures, and deficit (or surplus) which appear in our table above, in that they take account of expenditures and receipts by the trust funds and by the Government corporations. They are summarized in chart form, by quarters, in the Federal Reserve Charts on Bank Credit, Money Rates and Business, of February 11, 1941 (page 18). The chart shows an excess of cash outgo over cash income for the first two quarters of 1937, the excess for the second quarter being large; but it shows a small excess of cash income over cash outgo for the third quarter of 1937. The argument seems to be now that this excess of cash income over cash outgo for the third quarter of 1937 precipitated the stock market break and the business crisis of 1937.
An examination, however, of the actual figures of the Treasury 5 reveals two things: (1) the excess of cash income over cash outgo in the third quarter of 1937 was only $58,000,000, an extraordinarily small sum of money, even on this theory, to have upset a great economy which was pressing forward, with bank credit expanding and with new corporate security issues at the peak for many years; (2) the whole of the excess of cash income over cash outgo for the third quarter of 1937 came in September, the income tax month, where it appears as $203,000,000, instead of the $114,000,000 surplus given in our table for the budget figures, above. The months of July and August, 1937, show an excess of cash outgo, July’s excess being $120,000,000 and the excess of August being $25,000,000.
Now the stock market break started in August, before the September excess of cash income over cash outgo appeared, and it moved far in August. The Dow-Jones Industrials stood at 190.38 on August 14, and at 175.09 on August 27.
The business break, as shown by the weekly series of the New York Times Business Index, starts about four weeks after the stock market break began, but, unfortunately for this theory, it begins on September 11, before the big income tax payments came and while the Treasury was still undoubtedly having an excess of cash outgo over cash income. The business break, of course, actually began before September 11, since even weekly figures represent history rather than the contemporary fact on a given date. Moreover the business break continues with increasing momentum in October and November, during which months the Treasury had an excess of cash outgo over cash income, the figure for October being $193,000,000 and the figure for November being $90,000,000.
This refinement does not help the doctrine very much.
“Sterilization Fund” Did Not Reduce Excessive Bank Reserves. The contention that the Secretary of the Treasury’s sterilization policy took money away from the reserves of the banks or took money away from industry and trade or the securities market is simply absurd. The sterilization took no money away. It merely prevented incoming gold from adding to the money supply, a supply already very excessive.
The raising of the reserve requirements of the member banks did not deny any credit to anyone who could otherwise have got credit. It stopped no transaction which would otherwise have been made. It did not in any way interfere with the rising tide of business, with the rising tide of commercial loans, with rising bank deposits, with the issuing of securities, or with the rising prices of securities.
It is very important that we clear up misunderstandings regarding these points, lest excessive timidity regarding future money market control be generated by them.
Wages, Prices, and Profits. What then, were the explanations of the stock market crash and the business crisis? With respect to business, there is one outstanding fact. Business expands when profits are improving. Business contracts when profits decline or when there is a serious threat to profits. Now, profits are what is left of gross income after costs are subtracted, and the labor factor in costs is overwhelmingly important. In the years 1936 and 1937 labor income was running well over 70% of the total national income, whereas profit income did not exceed 15.3%.6
A 10% increase in aggregate labor income at the expense of aggregate profit income would thus mean cutting profit income approximately in half, which would lead to violent business reaction.
In individual establishments the amount of cost directly attributable to labor varies very greatly, and the percentage would normally be a good deal lower than 70%. The point is that many industries are working on prefabricated materials. They have already paid for labor when they bought the materials, and this labor element does not reveal itself in their direct labor costs.
Immense Union Activity Under Wagner Act Follows 1936 Election. There had not been a great deal of trade union activity, taking advantage of the opportunities made by the Wagner Act, until after the election of 1936. Then there came an immense activity headed by the C.I.O. under John L. Lewis, although the A. F. of L. and other labor organizations were not inactive. The focus of this was the automobile industry centering in Detroit. Here there were immense strikes, including “sit down” strikes, where laborers occupied the plants, refusing to vacate them, at the same time refusing to work—a clear violation of the law. But legal remedies were difficult to obtain from the State of Michigan at that time. Under these circumstances the automobile industries yielded. Unionization was rapidly accomplished and wages were rapidly raised. But all over the country, in lesser degree, similar movements were under way, and wages of manufacturing laborers generally were rapidly rising.
PRICES, WAGES AND THE COST OF LIVING
UNITED STATES, FRANCE, GREAT BRITAIN AND JAPAN
1929 = 100
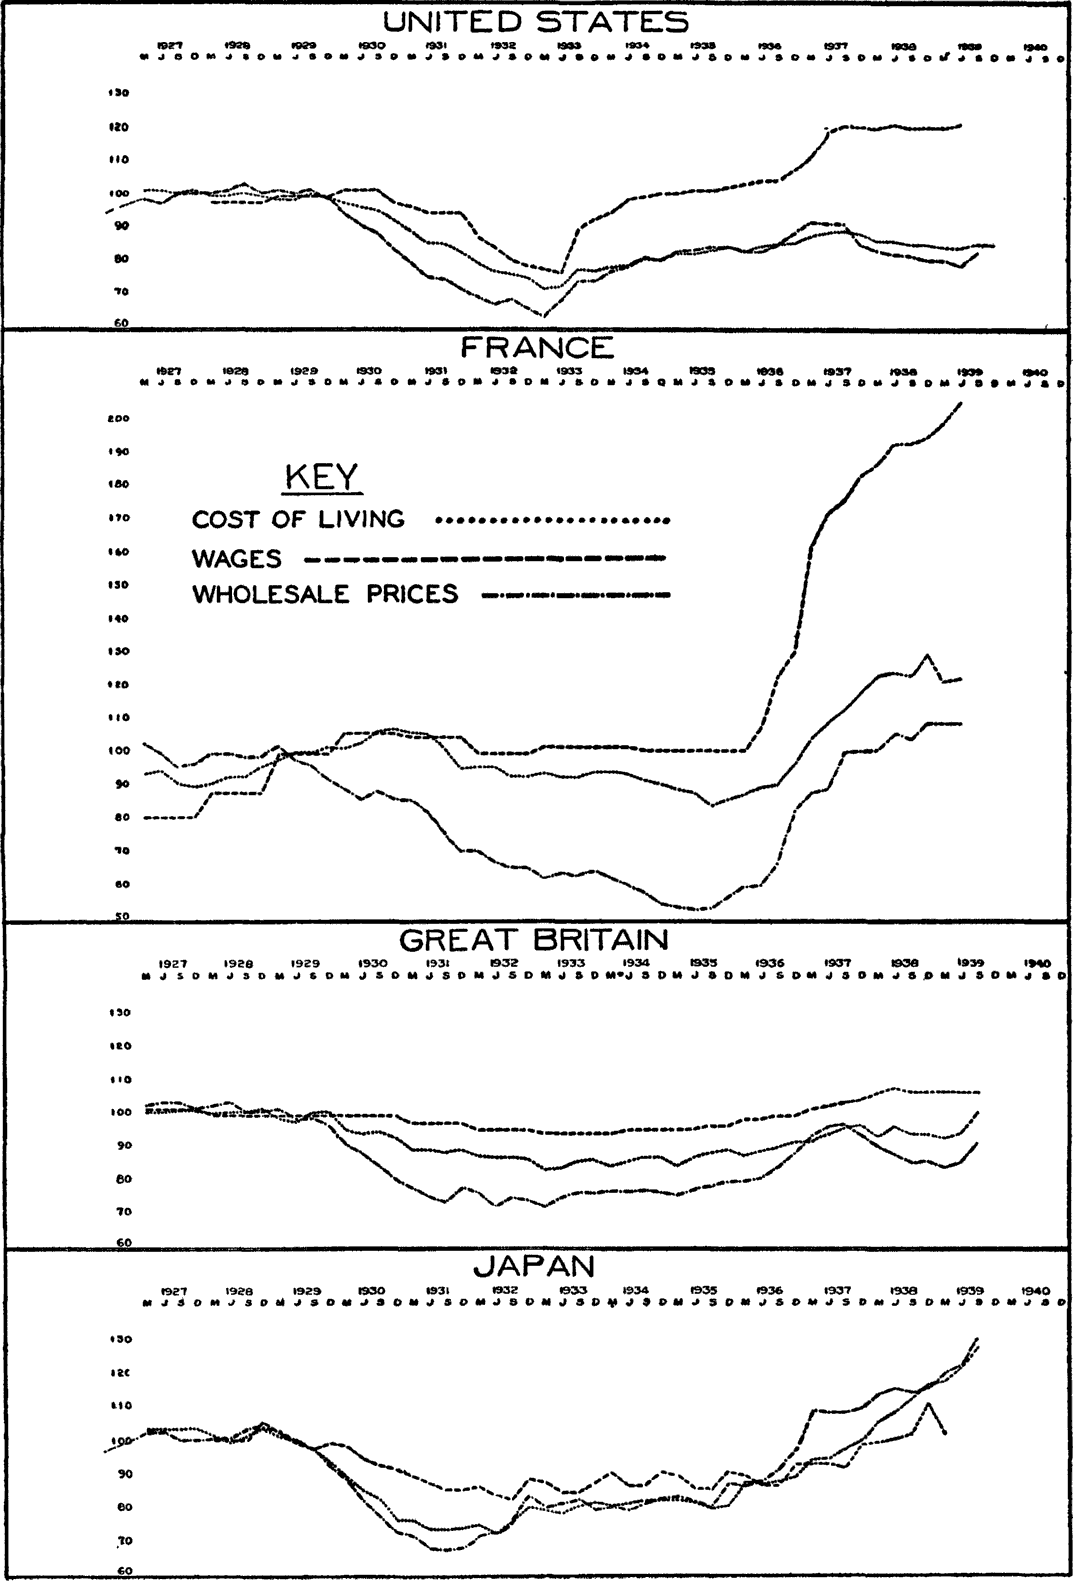
Rapid Rise in Wages Compared with Prices, 1937. A high official of the United States Government in the autumn of 1937 had in his office a chart which he had had prepared comparing Japan, Great Britain, France, and the United States with respect to the relationships among prices, wages, and the cost of living. The chart seemed significant and the present writer subsequently had it reproduced and continued through 1937 and into 1939. It is presented below. The official’s comment upon this chart was that, whereas in Great Britain and Japan there had been no very great variation in the relationship of these three series since 1929, in France there had been an appalling distortion in a startling rise of wages above wholesale prices and above cost of living, due to the Blum New Deal, with the resultant collapse in French industrial activity. He then called attention to the sharp rise in wages, running high above the cost of living and wholesale prices, beginning in 1936 and running into 1937 in the United States, and he said, “That looks too much like France.”
This a Main Factor in Crisis. A main factor on the industrial side in bringing the revival of 1935-1937 to a close was this startling increase in wages, due not to scarcity of labor, because unemployment remained at 6 1/4 millions for the year 1937, but due rather to a tremendous burst of activity by trade unions under the Wagner Act—a rise in wages unmatched by a corresponding rise in the productivity of labor.
There was also a very powerful financial cause of the business crisis, which we shall discuss in the next chapter.
- 1This point will be discussed at length in Chap. 34.
- 2I have not been able to find that this article was ever published. However, the reader will find much of it in two books by Veblen: Imperial Germany and the Industrial Revolution, New York, 1915; and The Nature of Peace and the Terms of Its Perpetuation, New York, 1917.
- 3See my book The Effects of the War on Money, Credit and Banking in France and the United States, published by the Carnegie Endowment for International Peace, Oxford University Press, New York, 1919. For London, see the interesting articles by Mr. J. M. Keynes in the British Economic Journal in late 1914.
- 4O. M. W. Sprague: “Crisis of 1914 in the United States,” American Economic Review, September, 1915; H. G. S. Noble: “The New York Stock Exchange in the Crisis of 1914,” Garden City, N. Y., Country Life Press, 1915. These two papers are classics of permanent value.
- 5The figures of all the State and National banks and trust companies appear only once a year in the Comptroller’s report as of approximately June 30. For dates other than June 30, it is necessary to make estimates. During the war period these estimates are made on the basis of variation in the National Bank figures.
- 6War Industries Board Price Bulletin No. 3, Government Control Over Prices, by Paul Willard Garrett, assisted by Isador Lubin and Stella Stewart, Washington, Government Printing Office, 1920, p. 550.