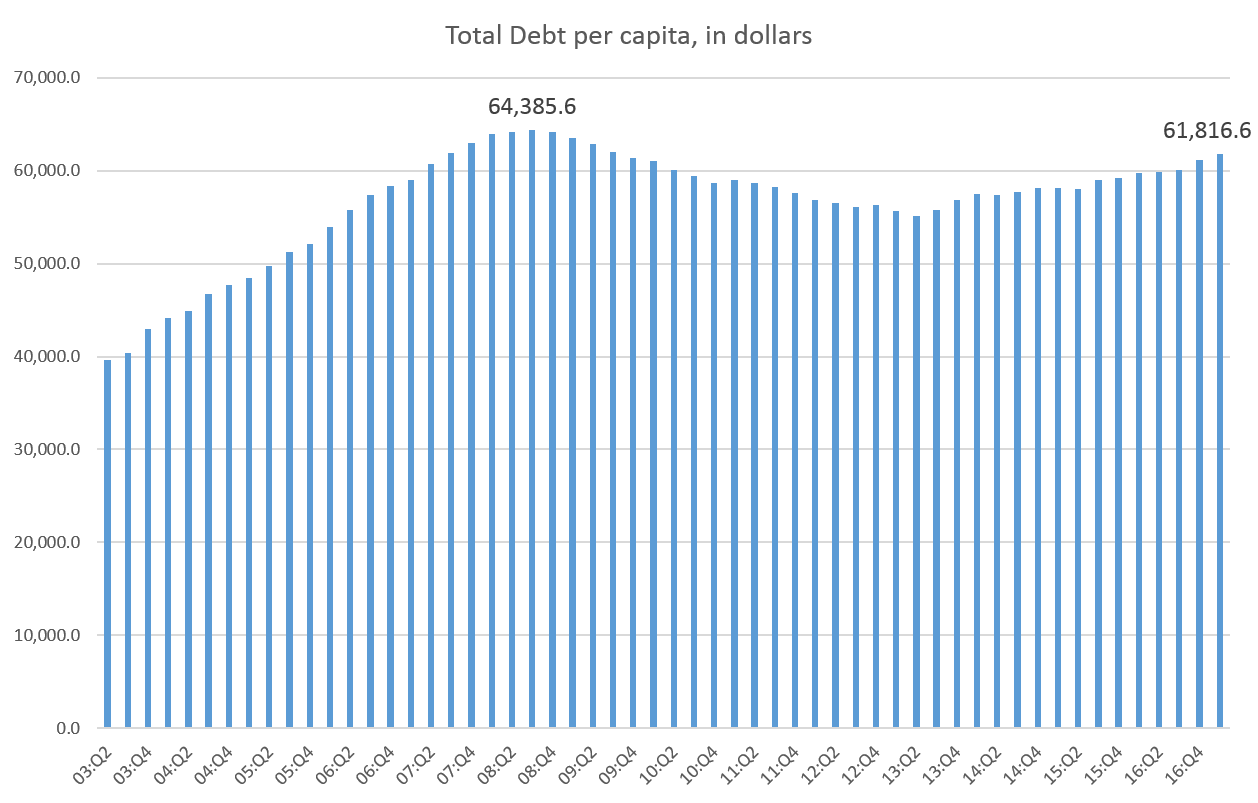
Following the 2008 financial crisis, many observers were surprised by how much many Americans began saving. From 2009 to 2012, total household debt fell considerably, dropping by more than 12 percent from 2008 to 2013.
According to the Wall Street Journal, that drop was described by Fed researchers as “an aberration from what had been a 63-year upward trend reflecting the depth, duration and aftermath of the Great Recession.”
Since 2013, though, household debt has again marched upward. And now, according to the New York Fed, household debt in the US has now topped its previous pre-crisis level. According to the Fed:
The CMD’s latest Quarterly Report on Household Debt and Credit reveals that total household debt achieved a new peak in the first quarter of 2017, rising by $149 billion to $12.73 trillion — $50 billion above the previous peak reached in the third quarter of 2008. Balances climbed in several areas: mortgages, 1.7 percent; auto loans, 0.9 percent; and student loans, 2.6 percent. Credit card balances fell 1.9 percent this quarter.
If we look at all the components of debt since 2009, we can see that most components remains near or below the former peak levels. What’s pushing total debt up is student debt and auto loan debt.

In this next graph, in which I index all debt levels to the 2008 3rd Q peak, we find that most debt components are near or below the old peak levels. Total debt (the black line) has just now risen above the old peak, with mortgage debt (the light blue line) still below the old peak (represented here by the value of 1). But, if we look at student debt and auto loan debt, we see that debt is well above its old peak. Student debt is now more than double what is was in 2008, and auto loan debt is almost 50 percent higher than the old peak.

Things are only slightly different if we account for growth in the working age population (ages 15–64). When we divide total debt by the working age population over time, we find that the per capita debt (which is $61,800 as of the first quarter this year) is still down 3.9 percent from the peak in 2008.1

Nevertheless, either way you look at it, the old debt-cutting ways of the population that prevailed in the wake of 2008 appear to now be over, and debt is mounting back to old peaks.
Not surprisingly, the largest components of total debt tend to benefit greatly from government interventions and subsidies. Mortgages are subsidized by a plethora of programs including loose monetary policy and a secondary market for loans dominated by government-owned Fannie Mae and Freddie Mac — not to mention the benefits of the too-big-to-fail FHA. Many student loans, of course, are directly subsidized by the federal government, and auto loans continue to be helped along by rock-bottom interest rates made possible by quantitative easing.
Thus, as auto loans and student loans become larger and larger parts of total household debt, we see it’s more than just mortgage housing, this time around. Jonathan Newman addressed some of these implications in March:
[T]his is more of an intended feature than a flaw of the Fed’s monetary policy since the housing bubble popped. Expansionary monetary policy can only replace bubbles with new bubbles. Malinvestments are not totally liquidated, but shift from one sector to another. Consumer debt is not directly paid off, but transferred from one type to another.
The redirection is mostly guided by new government interference in markets. Pre-2008, federal government programs to encourage new housing and mortgages, along with the low interest rates and new money from the Fed, created the housing bubble. Since 2008, programs like Cash for Clunkers, auto manufacturer bailouts, and income-based student loan repayment have funneled spending, borrowing, and increasing prices into education and autos.
Moreover, as with home loans in the late stages of the housing bubble, auto loans are seeing a rise in the total number of loans being made to customers with lower credit scores. Thus, it perhaps should not surprise us that serious delinquencies in auto loans are now near a six-year high:

With the exception of student loans, however, delinquency rates are not exceptionally high, and the current boom — while weak by historical standards — appears to be continuing.
The trouble will come when consumers can no longer keep up with debt payments and money begins to disappear from the fractional-reserve banking system, setting in motion deflation and recession.
It’s a correction that’s badly needed, but as of the first quarter of this year, at least, the money continues to flow, and debt is enabling many Americans to keep expanding their spending for now.
- 1This per capita figure is calculated by dividing the total debt level by the number of working-age persons in the US.


