

As a service to readers of the Mises Daily, I immerse myself in the sometimes-stultifying skirmishes of the economics blogosphere. Recently, those arguing that the solution to our current economic woes involves a pumping up of “aggregate demand” seem to have scored a major victory over the economists who believe the housing boom led to real resource misallocation. Although the Austrians are not mentioned by name in this dispute, the validity of the Mises-Hayek theory of the business cycle is clearly in question.
As has happened twice before in such controversies, the Keynesians need to look more closely at the data. Because I think the Austrian story is correct, I am not afraid to subject it to empirical verification. As we’ll see, the Austrian explanation comes through with flying colors.
Setting the Stage: Arnold Kling’s “Recalculation Story”
Our story begins when Arnold Kling reiterated to his readers that he thinks the conventional “aggregate-production-function” model in mainstream macro is “bogus.” Rather than looking at the economy as a giant “GDP factory,” Kling thinks it’s important for economists — at least when discussing the business cycle — to explicitly model the obvious fact that there are different sectors in the economy, and that workers are not interchangeable across sectors.
Kling calls his own view a “Recalculation Story” explanation of recessions. According to Kling, after an unsustainable boom period, the economy needs to “recalculate” and figure out where the excess workers (from the bloated sectors) need to go so that the economy can resume a stable, sustainable growth. This is very similar to the Misesian view of the “cleansing” role of recessions. Although not an Austrian himself, Kling does acknowledge that his theory is complementary to the Austrian view.
Scott Sumner Pounces
In a blog post that Brad DeLong described as doing “the Lord’s work,” Scott Sumner apparently demolished Kling’s story — taking down the Austrians as collateral damage. Here’s Sumner criticizing Kling:
There’s no question that Arnold Kling’s recalculation view is more intellectually appealing than the messy arguments about wage stickiness used by us “GDP factory” proponents. …
Yes, macroeconomics should be all about specialization and trade. Except business cycle theory, which needs a special ad hoc sticky wage/price model. Why? Because the evidence simply doesn’t fit any other approach. Here’s Kling on the construction bust:
[Kling:] I want to suggest that the output that is “lost” is output that people do not want. In 2008 and 2009, Americans do not want 2 million houses to be built. So I do not think that it is right to speak of a shortfall in output. Instead, we should say that the people who were building houses have not found a pattern of trade in which they can produce something that people want.
Yes, housing output was low in 2009 and unemployment was high. But is there a causal relationship? I say no. Housing starts peaked in January 2006, and then fell steadily for years:
January 2006 — housing starts = 2.303 million, unemployment = 4.7%
April 2008 — housing starts = 1.008 million, unemployment = 4.9%
October 2009 — housing starts = 527,000, unemployment = 10.1%
So housing starts fall by 1.3 million over 27 months, and unemployment hardly changes. Looks like those construction workers found other jobs, which is what is supposed to happen if the Fed keeps NGDP growing at a slow but steady rate.
It wasn’t only DeLong who thought the above statistics were crushing; Kling himself basically threw in the towel when he conceded, “Ouch. I would prefer to use residential construction activity, rather than housing starts … but the point remains. Most of the decline in housing construction was behind us by October of 2009.”
Kling’s surrender was premature. When we look at more appropriate data, we find confirmation of the general Austrian (and “recalculation”) viewpoint. But before making my case, I want to be sure the reader understands why Sumner, DeLong, and even Kling thought that Sumner’s statistics were so deadly.
Kling (and the Austrians) are arguing that this recession is not simply about a lack of generic “spending” but rather is tied to the preceding housing boom. In particular, during the boom, workers were sucked into construction (and other related occupations). Once the housing bubble collapsed, these excess workers needed to go someplace else. That’s why unemployment started rising, and “the recession” set in.
In terms of government policy, Kling (and the Austrians) argue that this is a real misallocation of resources: too much lumber, glass, and yes, labor went into housing during the boom years. In order for the economy to readjust to the new situation, it takes time for workers to leave the housing sector and to match up their skills with the desires of consumers in a more sustainable pattern.
In a simple mainstream model, where we have one giant production function Y=F(K,L), and in which there is a “stock” of capital and a certain “amount” of homogeneous laborers, you won’t pick up such fine nuances. In that world, especially if we assume that prices are “sticky,” it might be true that massive government deficit spending — or money drops from the Fed — could boost “aggregate demand” and restore full employment. But in the real world, if consumers want to spend their money on software, but the unemployed workers are coming from construction, this Keynesian solution isn’t going to work.
Hopefully the reader can now see the apparent power of Sumner’s statistics. If the recession were about real resource misallocation — as opposed to a nominal spending shortfall — we would expect the unemployment rate to vary according to the fortunes of the housing sector. In other words, if Kling and the Austrians were right, we would have expected the drop in home construction to match up closely with the rising unemployment rate as those laid-off workers tried to find something else to do.
Now that we understand Sumner’s argument, let’s see why it breaks down.
Housing Starts versus Construction Employment
Here’s the crucial portion of Sumner’s blog post: “So housing starts fall by 1.3 million over 27 months, and unemployment hardly changes. Looks like those construction workers found other jobs …”
There’s just one problem with Sumner’s argument: housing starts are not synonymous with construction jobs. In fact, from January 2006 to April 2008 — the period when Sumner thinks construction workers must have been laid off in droves because housing starts fell by more than half — US construction employment only fell from 7.6 million to 7.3 million. Here’s a graph showing housing construction (blue) versus the national unemployment rate (red):

I submit that there is nothing embarrassing in the above chart for the Austrian (or Klingian) theory. As the housing boom intensified, sucking more and more workers into construction, the national unemployment rate steadily fell. Then, as the housing boom tapered off, extra workers stopped getting siphoned into the housing sector, and the national unemployment rate bottomed out. Finally, as construction employment began falling, the national unemployment rate began rising.
So what is wrong with Sumner’s approach? Well, part of the problem is encapsulated in Kling’s critique — Sumner isn’t viewing the economy as a complex capital structure, with various lines of interlocking production processes that have to “mesh” in order for the finished output to keep popping out of the terminal. Rather, Sumner and his Keynesian allies are thinking of the economy as a bunch of masseuses or stand-up comedians, in which there are not dedicated capital goods that must augment the laborers in each field. In their world, when consumer spending switches (or freezes up altogether), the production structure just turns on a dime; there’s no “memory” in the capital stock of what the patterns of output were before the sudden disruption.
But in the real world, and particularly in the housing sector, time and capital structure are crucial. In the years leading up to 2006, housing starts steadily expanded. Now if they had simply leveled off in January 2006 — so that (annualized) housing starts every month thereafter remained at the permanently high plateau of 2.3 million — construction employment would have continued rising after that date.
The reason is that there’s more to the construction sector than simply starting new houses. That fact alone buys us another few months, as a look at housing completions shows (Download PDF”).
But more important, construction workers are needed to maintain an existing stock of housing. In other words, if the builders had kept constructing new homes at an annualized rate of 2.3 million from January 2006 onward, and if families moved in to them as in normal times, total construction employment would have needed to rise above its January 2006 level. Those workers were needed to keep cranking out the brand new houses, and it would have taken new workers (siphoned from elsewhere in the economy) to, say, add a new deck in the backyard or build a shopping mall down the street from a new housing development.
I am an economist, not an expert in housing or construction. I do not pretend to know exactly what construction workers were doing in the two years after housing starts peaked. But what I do know is that Sumner is wrong in his assessment of the labor markets. Contrary to Sumner, there is no huge reallocation of construction workers (from January 2006 to April 2008) that Kling or the Austrians must explain.
To see that Sumner is glossing over some interesting dynamics in the labor markets, we can look at more refined data. Insted of looking at total construction employment (as I’ve done in the charts for this article), we can look at the more narrow BLS classification of “construction laborers,” which ironically went up from May 2006 to May 2007 (from 1.02 million to 1.05 million). In contrast, during the same period the employment of “brickmasons and blockmasons” went down from 118,080 to 116,290. So it’s not surprising that the national unemployment rate didn’t shoot up in this period, because the 2,000 laid-off masons aren’t a large segment of the labor force.
Connecting the Housing Bubble with Construction Employment
In this section, I want to offer two more graphs to drive home the validity of the Austrian (and Klingian) story. The following graph shows construction employment (blue) versus an index of US home prices (red):
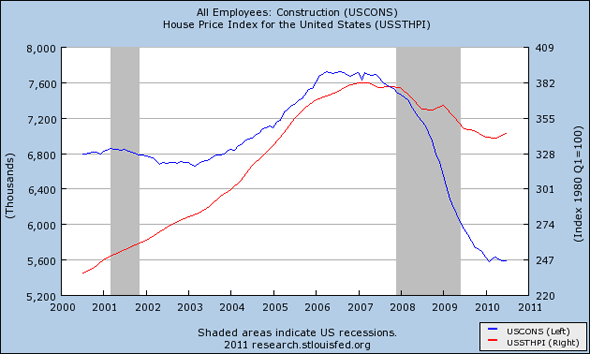
Didn’t this picture turn out just the way Kling and the Austrians would have hoped? As house prices rocketed upward (fueled by Greenspan’s policies, I would argue), builders ramped up production, sucking more workers into housing. Then, when prices tapered off, so did construction employment. Finally, both began tumbling at about the same time (and home prices probably would have crashed even harder had the government and Fed not tried to prop them up with every trick in the book).
Now DeLong or Sumner might object that I’m mixing up causation with correlation. For whatever reason, consumers got yellow in late 2007 and did the unthinkable — they started saving some of their incomes. Thus, everything started dropping at that point, including home prices and construction employment. But there’s nothing “real” in this story corresponding to the Austrians’ worries about “too much housing,” Sumner and DeLong might argue.
That’s the beauty of the following chart. It graphs construction employment (blue) against the home vacancy rate (red):

For those who want to call the housing years a bubble, and to blame it for misallocations in the labor markets, the above graph is very reassuring. The rising red line shows that a rising percentage of homes in the United States were not being lived in. This is exactly what we would expect in the midst of a speculative bubble, where people were taking on second and third homes not to live in, or even to rent out, but simply to “flip.” (Note that Paul Krugman endorses this same logic when it comes to rising oil prices and the question of whether they are driven by speculation or “fundamentals.” The signature of speculation is the physical withholding of the product from end users.)
So to repeat, the final chart above fits in nicely with the Austrian story. We don’t even have to look at market prices as a gauge of the housing bubble; we can look at something physical, namely the percentage of homes that are vacant. Here too, the employment — both up and down — in construction follows pretty closely to the size of the housing bubble.
We Can’t Ignore the Effects of TARP, Fed Bailouts, and the Stimulus Package
Before closing, I want to remind Arnold Kling and other sympathizers with the Austrian reallocation story that the economy is suffering from more than the housing bust. If the government had done nothing, then there would have been a bad recession in 2007–2008. But it would be long gone by now. Home prices and the stock market would have crashed, but unemployment would now be at regular levels.
Instead, we suffered a string of interventions in the market, including TARP, backdoor Fed bailouts of more than $1 trillion, a “stimulus” package of more than $700 billion, extensions of unemployment benefits, a massive overhaul of health insurance, stop-and-go bans on offshore drilling, and the EPA’s unilaterally announcing it would regulate carbon emissions.
In this context, it is not embarrassing for free-market economists that the economy has tanked since the fall of 2008, and that it seems to be taking a long time to bounce back from a cute little housing bubble. Again, this is exactly what the Austrians said would happen, namely, that these enormous interventions would only prolong the recession and interfere with the necessary reallocation of workers into sustainable niches.
Conclusion
This is actually the third time our famous Keynesians have improperly used statistics to (in their mind) refute the Austrian reallocation story. At one point, Krugman and DeLong claimed that the unemployment rates among individual states bore no relation to the sizes of their respective housing bubbles. But they were using the wrong period to test their theory, and once we corrected for that the losses in jobs among the states fit very nicely with the state-level drops in the housing market.
On another occasion, Krugman argued that the fall in manufacturing employment was more severe than in construction, and that this embarrassed the misallocation theorists. But I pointed out that the percentage drop in construction employment was much worse than in manufacturing, and that the analysis of the two sectors — even if we decomposed manufacturing into durable and nondurable goods — was exactly in line with textbook Austrian theory. In contrast, if this recession were merely about “not enough spending,” there was no reason for the sectors to have behaved the way they did.
And so we are now on our third (and counting?) attempt by the Keynesians (and their occasional Chicago School comrade, Sumner) to use statistics to beat the Austrian theory. Now that I have once again shown that the data match the Mises-Hayek story pretty well, I’m assuming they will be converted to our way of thinking.

