From its low on March 11, the Dow Jones Industrial Average has risen 20.5% (see chart), the S&P500 has increased by 23.4% (see chart) while the Nasdaq Composite has climbed 28% (see chart).


Is this rebound indicative of the emergence of a new bull market? It is tempting to suggest that this may be the case. After all, stock price indices have been in a downtrend for quite some time. Thus the Dow and the Nasdaq have been in downtrend since January and March 2000 while the S&P 500 has been trending down since September 1 2000.
What do we mean by bull and bear markets? A bull market is associated with a general up-trend in stock price indices, while a bear market is associated with a general downtrend in these indices. As a rule, in order to sustain a general up-trend in stock prices there must be a continuous increase in money supply.
The more money that is pumped the higher stock prices will be, all other things being equal. The seemingly positive effect that monetary pumping produces is on account of a growing stock of real wealth. The rising stock signifies that a growing percentage of businesses in an economy are making real profits. In short, as long as real wealth is expanding monetary pumping can set in motion a general up-trend in stock prices.
Why is that so? An expanding real wealth, implies good performance of the majority of activities, hence an up-trend in stock prices. Once, however, the stock of real wealth starts to fall, all other things being equal, this means that less can be allocated towards real savings. This in turn means that there is less real funding to support real economic growth.
In short, a fall in economic activity follows a fall in real funding and hence the support behind the illusion that monetary pumping generates falls apart. Consequently, a reversal in the up-trend of stock price indices ensues. Note that in order to maintain an up-trend in stock prices along a given growth path there must be ever expanding injections of money. Once, however, the point is reached at which the stock of real savings begins to shrink as a result of monetary pumping the stock price indices up-trend collapses.
Observe that aggressive monetary pumping has difficulties in generating a general rising trend in stock prices if the stock of real wealth is declining. If real wealth is declining then it means that there are more businesses that are making real losses than businesses that are making real profits.
Obviously, under these conditions monetary pumping can not generate a sustained up-trend in price indices. All that will emerge is oscillations around the downtrend. These oscillations signify the reshuffling of real savings from profitable to non-profitable activities i.e. a reshuffling effect. Incidentally, the reshuffling effect is also observed in a bull market as a result of the central bank monetary policies. In short, there will be oscillations around the rising trend of stock price indices.
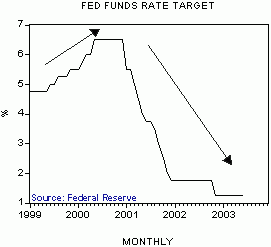
The tighter monetary stance that the Fed introduced on June 1999 has likely triggered the present bear market. The Federal Funds rate target rose from 4.75% in June 99 to 6.5% by May 2000 (see chart). The tighter stance was kept in place until January 2001 when the Fed began a new cycle of easing, lowering the Fed Funds rate target to 1.25% as of November 2002.

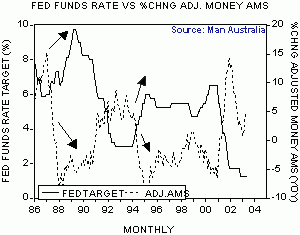
A sharp fall in the momentum of money AMS (an Austrian definition of the money supply) adjusted for nominal economic activity mirrors closely the tighter stance adopted by the Fed. Year-on-year adjusted money AMS fell from -1.6% in June 1999 to -6.5% in January 2001 (see chart).

Note that the fall in the growth momentum of adjusted money AMS between January 2002 and January 2003 corresponds to an unchanged interest rate stance during this period. The unchanged interest rate stance also corresponds to a fall in the growth momentum of the money base (see chart). Against the background of weakening in economic activity, in order to sustain the Fed Funds rate target of 1.75% during that period the Fed had to slow down its monetary pumping.

Now, since January of this year the growth momentum of adjusted money AMS shows a visible rebound. The yearly rate of growth jumped from 1% in January to 5.5% in May. An expected lowering of the Federal Funds rate target this month is likely to strengthen the growth momentum of adjusted money AMS further. All this should provide strong support for the stock prices of various non-productive activities at the expense of wealth generating activities.
Again it must be realised though that a looser monetary stance can only reshuffle a given pool of real savings. However, if the pool is stagnant or falling general economic activity cannot increase. Consequently, no general up-trend can emerge in the stock market. All that can occur are fluctuations around a horizontal, or declining trend, so to speak.
Various key economic data raises the likelihood that the stock of real wealth is likely to be under pressure. Thus the consumer liability - to -assets ratio climbed to a new record high of 0.185 in Q1 from 0.182 in Q4 2002 (see chart). Year-on-year consumers’ real net worth fell by 7.5% in Q1 after a fall of 5.9% in the previous quarter. This was the 4th consecutive quarterly decline (see chart).

Moreover, the non financial debt-to-GDP ratio jumped to a new record high of 1.965 in Q1 from 1.953 in Q4 (see chart). Also, the fact that the personal income to consumption ratio remains in free fall is another indication that the pool of real savings is in trouble (see chart).

The aggressive lowering of interest rates by the Fed has significantly arrested the pace of liquidations of past excesses. This in turn continues to maintain pressure on the sources of real growth. In short, the existence of non-productive activities constitutes a drain on these sources. In this respect, the production of durable consumer goods-to-non-durable consumer goods ratio eased to 1.13 in April from 1.14 in March. This must be contrasted with an historical average of around 0.7 (see chart). The ratio of business equipment production - to - non-durable goods production was unchanged at 1.02 in April from March against the historical average of 0.6 (see chart). In other words, the liquidation of past excesses has barely begun. Obviously then no sustained economic recovery can emerge while the source of real funding is under pressure.

Despite the sharp fall over the past three years stock prices still remain expensive. Thus the trailing P-E ratio of the S&P 500 stocks (using reported earnings) stood at 34.55 in May against 33.23 in April. This is way above the historical average of 18 (see chart). The dividend yield on S&P500 stocks fell to 1.72% in May from 1.78% in the previous month (see chart). This must be contrasted with an historical average of 131 years of 4.6%.

The Fed’s determination to counter deflation by a likely intensification of monetary pumping in the months ahead will undermine the stock of real wealth further. While this may temporarily lift the stock market the overall downtrend in the Dow Jones Industrial Average (see chart) and the Nasdaq Composite (see chart) that begun three years ago is likely to remain intact.

In this regard there are a lot of similarities with Japan as far as the low interest rate policy is concerned. Despite the relentless lowering of interest rates, which are currently at around zero, stock prices in Japan have been trending down for over twelve years now (see chart).

To conclude then, it is quite likely that businesses’ ability to generate real wealth has been severely impaired. This in turn precludes the possibility of a sustained economic recovery and thus the emergence of a durable up-trend in stock price indices i.e. new bull market. An expected loosening in the monetary policy of the Fed is likely to further aggravate the state of the real economy and the stock market.


