

The latest economic data indicate that the prospects for a sustained economic recovery have been further delayed. The low interest rate policy of the Fed remains the major factor behind this deterioration.
Last Wednesday the Fed announced that it would keep the federal funds rate target unchanged at 1.25%—at a 41-year low. Also, to encourage consumers and businesses to spend more, President George Bush proposed a $670 billion tax cut plan.
The underlying view that continues to motivate policy makers is that what drives the economy is demand for goods and services. However, it is overlooked that increases in demand as such cannot grow the economy. What is necessary for economic expansion is growth in saved resources that form the basis of investible capital. It is the state of this pool of real funding that dictates the rate of increase in the production of goods and services. Without the availability of real funding, irrespective of how strong demand is, no economic growth can emerge.
In a free and unhampered market economy, consumption and production interact harmoniously with each other. In other words, consumption is fully backed up by production while production is fully supported by consumption. Whenever the central bank and the government introduce policies that aim at boosting expenditure by both consumers and producers it disrupts the harmony between production and consumption and undermines prospects for economic growth.
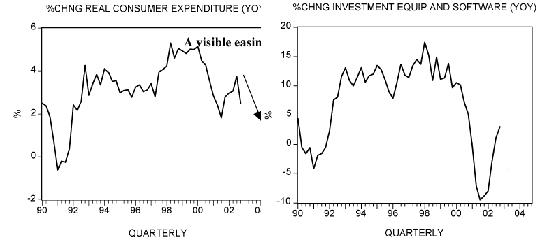
The latest data indeed indicates that this is precisely the case. The national accounts data for Q4 shows that the yearly rate of growth in real consumer expenditure eased to 2.5% in Q4 from 3.8% in Q3 (see chart). In contrast to this, business expenditure on equipment and software in real terms increased year-on-year by 3% in Q4 after growing by 1.1% in the previous quarter and a fall of 8% in Q1 (see chart).
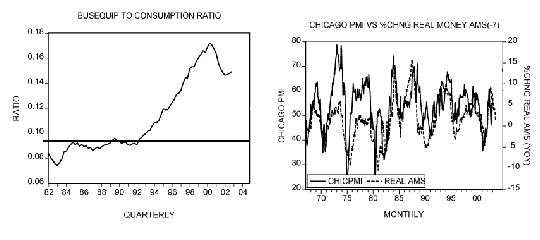
Consequently, the business investment-to-consumption ratio jumped to 0.15 from 0.147 in Q3 (see chart). In short, the adjustment process (i.e. adjustment towards harmonious production) was reversed in Q4. The Q4 ratio is way above the 0.09 where we have estimated a sustainable economic recovery can emerge. This in turn means that any additional increase in the business investment to consumption ratio will only further weaken the pool of real funding and thereby delay the emergence of a sustainable economic recovery.
The latest manufacturing activity data indicates that there is the possibility that manufacturers have lifted their activity in January. If this is the case, then this is likely to result in the accumulation of unwanted inventories. Needless to say, this also means more pressure on corporate profits. This is bad news for the stock market. The Chicago purchasing management index (PMI) rose to 56 in January from 51.7 in the previous month. This was the 3rd consecutive month that the indicator stood above the 50 mark, which marks expansion. Despite this strengthening our monetary analysis indicates that this rise is unlikely to be sustained (see chart).
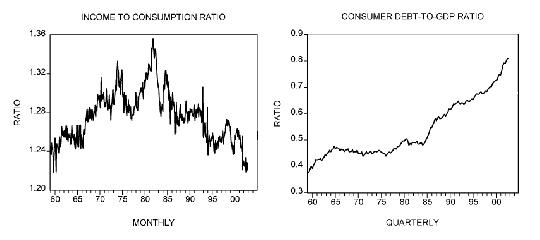
For the time being personal savings remain under pressure. In December the personal savings rate fell to 4.1% from 4.5% in November. The sharp fall in the personal income-to-consumption ratio indicates that savings, and hence the pool of real funding, are under pressure (see chart). Moreover, given the massive levels of consumer debt it is questionable whether consumers can maintain their aggressive pace of spending by further lifting their debt levels. We have estimated that in Q4 consumer debt-to-GDP ratio climbed to a new record high of 0.81 from 0.808 in Q3 (see chart).
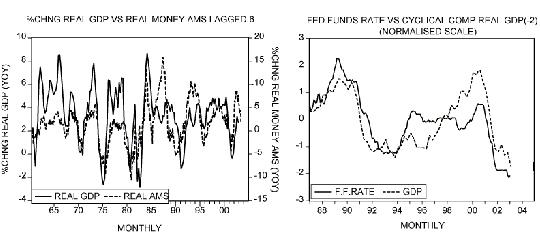
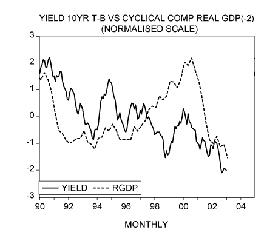
In the meantime, the real GDP rate of growth decelerated sharply in Q4. The GDP rate of growth slowed to a 0.7% annual rate in Q4 from 4% in Q3. For 2002 GDP grew by 2.4%, following a 0.3% increase in 2001. The cyclical component of real GDP fell to -196 in Q4 from -134 in the previous quarter (see chart). Without government spending, GDP contracted slightly in Q4. Within the government sector, defense spending rose at an 11% annual rate (see chart).
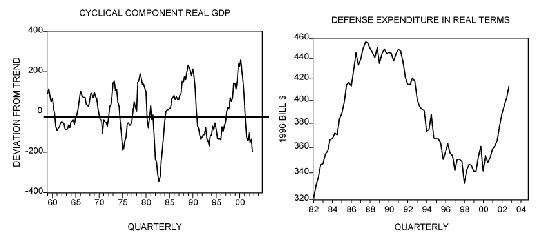
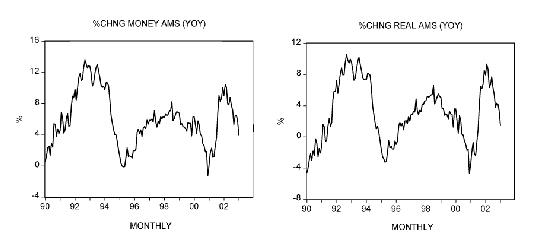
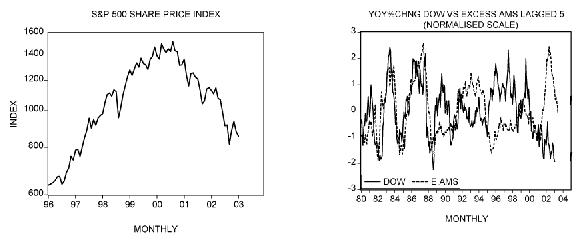
What's more, the yearly rate of growth of real GDP fell to 2.8% in Q4 from 3.3% in Q3. Our monetary analysis, which is based on the lagged yearly rate of growth of real money AMS raises the likelihood that the growth momentum of real GDP will remain under pressure (see chart). In addition to this, a sharp fall in the cyclical component of real GDP raises the likelihood that the Fed may consider a further lowering of the federal funds rate target which is currently at 1.25% (see chart).
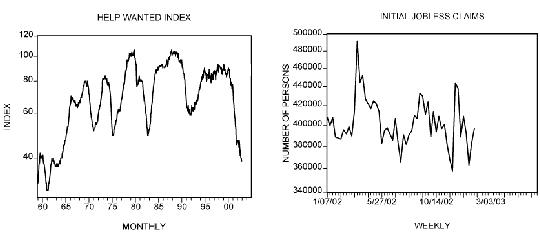
In the meantime, the number of help-wanted ads in major US newspapers dipped in December. The Help Wanted Advertisement Index fell to 39 in December from 40 in November. One year ago the index stood at 47 (see chart). Other reports also indicate that the job market is not getting any better. The number of Americans making their first filing for state unemployment benefits rose in the latest week by 14,000 to 397,000 (see chart).
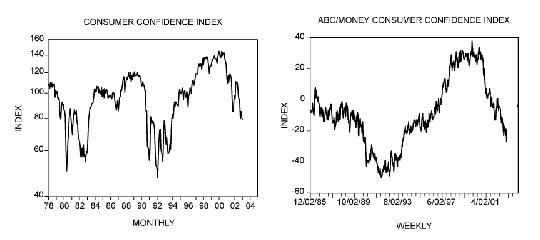
In addition to this, the consumer confidence index fell to 79.0 in January from 80.7 in December (see chart). Moreover, in the week ending January 26 the ABC/Money magazine consumer confidence index stood at -27, its lowest level since December 1993 (see chart). Also, the University of Michigan consumer sentiment index fell to 82.4 in January from 86.7 in December.
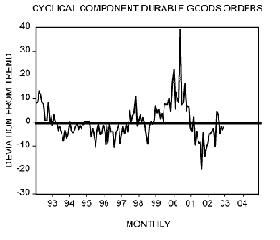
Although durable goods orders increased by 0.2% in December, after a fall of 1.3% in the previous month, the growth momentum of orders indicates softening. The yearly rate of growth of durable goods orders fell to 1.7% from 3.7% in November. The cyclical component of orders stood at -2.2 in December against -3.1 in November and this was the 4th consecutive month that durable goods orders were below long term trend (see chart).
Money AMS rises slightly in week ending January 20
In the week ending January 20 money AMS increased by $0.9 billion from the previous week. The yearly rate of growth stood at 3.9% against 5.8% in December (see chart). For the time being the growth momentum of real money AMS remains in a downtrend (see chart). This in turn continues to exert downward pressure on activities, which sprang up on the back of the previously rising growth momentum of real money AMS.
Housing market still holding
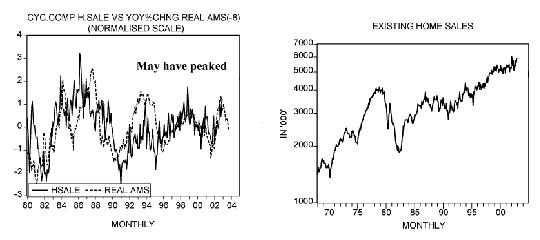
Sales of new single family homes increased by 3.5% in December following a rise of 3.9% in the previous month. New home sales stood at 976,000 in 2002—the highest level since the Commerce Department began tracking sales in 1963. Moreover, the median price of new homes increased by 7.2% in December after rising by 3.9% in November. The cyclical component of sales jumped to 113.2 in December from 79.3 in November. Our monetary analysis, which employs the lagged yearly rate of growth of real money AMS, raises the possibility that the cyclical component is not far from its peak (see chart).
Also, existing home sales have continued to march ahead. In December sales increased by 5.2% from November to a seasonally adjusted annual rate of 5.86 million units against 5.57 million units in November (see chart). Home sales for 2002 stood at a record of 5.56 million units. An increasing likelihood that the housing market may not be far from its peak is indicated by the fact that banks are becoming more selective in their home mortgage lending. According to a Federal Reserve report banks continued to toughen home lending standards in recent months. The share of banks surveyed that reported tighter mortgage standards rose to 11.1%, up from 10% in the previous report released in November. This was the first indication of tighter mortgage credit in over a decade.
US dollar strengthens against major currencies
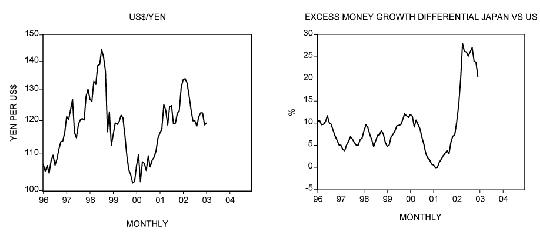
On Friday the Yen had its biggest decline against the US dollar in three weeks, after the Bank of Japan reported it had sold about 700 billion yen ($5.88 billion) since mid-January to slow a rally in Yen. The Yen fell to 119.87 per US dollar from 118.74 the previous day (see chart). The underlying driving factor that sets the currency rate of exchange is the relative scarcity of a currency. Relative scarcity means the supply of a given currency in relation to its demand. Thus, if on a relative basis the US money supply is growing much faster than Japan’s money supply, over time this is likely to depress the US dollar against the Yen.
Excess money supply in a particular country can be ascertained by comparing the rate of money growth to the rate of growth of GDP. In addition to this, since changes in the money rate of growth exert their effect with a lag it means that what matters in the assessment of the currencies rate of exchange is the lagged excess money growth differential. Inspection of the following chart raises the likelihood that past strong acceleration in the excess money growth differential between Japan and the US is likely to start to assert its dominance (see chart). This in turn should provide strong support for the US dollar against the Yen.
On Friday the dollar also had its biggest gain in four weeks against the Euro. The US dollar rose to $1.0771 per Euro from $1.0823 on Thursday (see chart). The lagged excess money growth differential between Euroland and the US points to a strong support for the US dollar against the Euro in the months ahead (see chart).
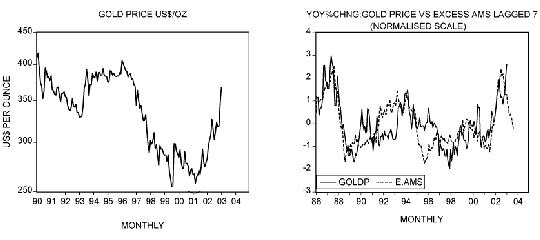
Gold still shining but for how long?
After falling to $274/oz in November 2001 the price of gold has been in a strong up-trend closing at $367.40/oz at the end of January (see chart). Apart from the Iraqi factor a major driving force behind the rise in the price of the yellow metal has been a strong increase in US money AMS in relation to nominal economic activity. After falling to -6.4% in December 2000 the yearly rate of growth in adjusted money AMS (excess AMS) climbed to 14.5% by December 2001. From then onwards the adjusted money AMS rate of growth has been falling. We have estimated that this measure of liquidity fell to -0.6% at the end of January. Given the fact that the yearly rate of growth of adjusted money AMS exerts its effect after a lag of about 7 months we can suggest that the growth momentum of the price of gold could come under pressure in the months ahead, all other things being equal (see chart).
Soft economic conditions provide support to T-Bonds
The yield on the 10 year T-Bond eased to 3.97% in January from 4.03% in the previous month (see chart). The differential between the yield on the 10-year T-Bond and the federal funds rate fell to 2.59% in January from 2.78% in December (see chart).
Whilst the recent rebound in the growth momentum of price inflation and a fall in our liquidity measure remain negative for T-Bonds, subdued economic activity continues to provide support to T-Bonds (see chart).
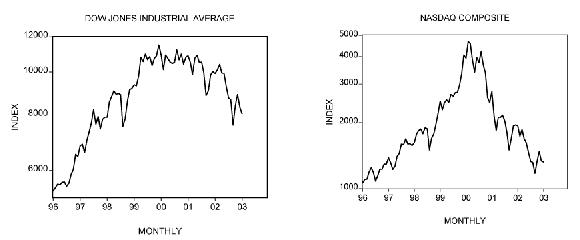
US stocks weaken further in January
For the month of January the Dow Jones Industrial average fell 3.5% (see chart), while the Nasdaq Composite lost 1.1% (see chart). The S&P500 shed 2.7% in January from December (see chart). For the time being a visible fall in our liquidity measure doesn't bode well for the stock market (see chart). Year-on-year money AMS adjusted for nominal economic activity fell to -0.6% in January from 1.3% in December.
Conclusion
From the outset of what Greenspan calls this "soft patch," the Fed has pursued lower interest rates, while policy makers have pursued a policy of spending to stimulate aggregate demand. It should be clear that neither offer a path toward rebuilding the foundation for future economic growth.
